Model Context Protocol (MCP) finally gives AI models a way to access the business data needed to make them really useful at work. CData MCP Servers have the depth and performance to make sure AI has access to all of the answers.
Try them now for free →
Access Salesforce Data in QlikView Using the CData ODBC Driver for Salesforce
One of the strengths of the CData ODBC drivers is that it can be accessed by a broad spectrum of third-party applications; all of the CData ODBC drivers are compatible with QlikView. You can use the CData ODBC driver for Salesforce to create visualizations in QlikView.
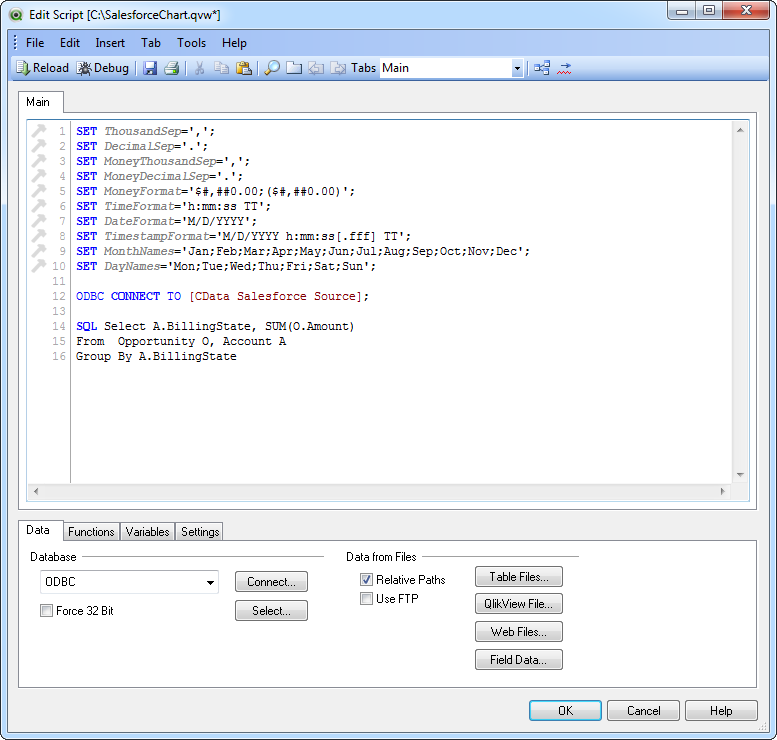
In this article we create a bar chart that sums the size of all opportunities in each state. The query below will get us the data we seek:
Select A.BillingState, SUM(O.Amount)
From  Opportunity O, Account A
Group By A.BillingState
Populate a chart with the data
The steps below supply the results of our SQL query to a visualization in QlikView.- Click Edit Scripts and add the connection and the query. You can select the DSN on the Data tab in the Edit Scripts wizard. You should already have a DSN configured on your machine. See the documentation of the CData ODBC Driver for Salesforce to configure a DSN.
![]()
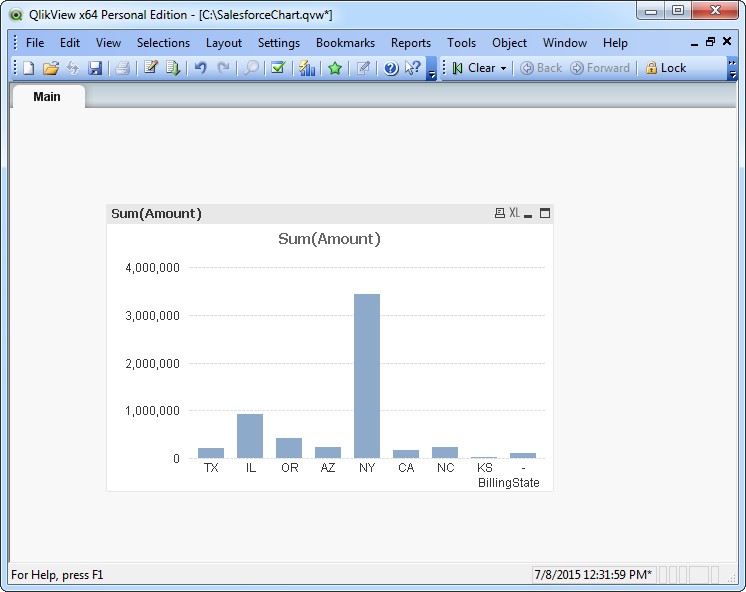
- Create a new bar chart with BillingState and SUM_O_Amount as the x- and y-axes using the Create Chart wizard.
- Finish the wizard to generate the chart and see the results of your query.
![]()