Model Context Protocol (MCP) finally gives AI models a way to access the business data needed to make them really useful at work. CData MCP Servers have the depth and performance to make sure AI has access to all of the answers.
Try them now for free →Use Dash to Build to Web Apps on BigQuery Data
Create Python applications that use pandas and Dash to build BigQuery-connected web apps.
The rich ecosystem of Python modules lets you get to work quickly and integrate your systems more effectively. With the CData Python Connector for Google BigQuery, the pandas module, and the Dash framework, you can build BigQuery-connected web applications for BigQuery data. This article shows how to connect to BigQuery with the CData Connector and use pandas and Dash to build a simple web app for visualizing BigQuery data.
With built-in, optimized data processing, the CData Python Connector offers unmatched performance for interacting with live BigQuery data in Python. When you issue complex SQL queries from BigQuery, the driver pushes supported SQL operations, like filters and aggregations, directly to BigQuery and utilizes the embedded SQL engine to process unsupported operations client-side (often SQL functions and JOIN operations).
About BigQuery Data Integration
CData simplifies access and integration of live Google BigQuery data. Our customers leverage CData connectivity to:
- Simplify access to BigQuery with broad out-of-the-box support for authentication schemes, including OAuth, OAuth JWT, and GCP Instance.
- Enhance data workflows with Bi-directional data access between BigQuery and other applications.
- Perform key BigQuery actions like starting, retrieving, and canceling jobs; deleting tables; or insert job loads through SQL stored procedures.
Most CData customers are using Google BigQuery as their data warehouse and so use CData solutions to migrate business data from separate sources into BigQuery for comprehensive analytics. Other customers use our connectivity to analyze and report on their Google BigQuery data, with many customers using both solutions.
For more details on how CData enhances your Google BigQuery experience, check out our blog post: https://www.cdata.com/blog/what-is-bigquery
Getting Started
Connecting to BigQuery Data
Connecting to BigQuery data looks just like connecting to any relational data source. Create a connection string using the required connection properties. For this article, you will pass the connection string as a parameter to the create_engine function.
Google uses the OAuth authentication standard. To access Google APIs on behalf of individual users, you can use the embedded credentials or you can register your own OAuth app.
OAuth also enables you to use a service account to connect on behalf of users in a Google Apps domain. To authenticate with a service account, you will need to register an application to obtain the OAuth JWT values.
In addition to the OAuth values, you will need to specify the DatasetId and ProjectId. See the "Getting Started" chapter of the help documentation for a guide to using OAuth.
After installing the CData BigQuery Connector, follow the procedure below to install the other required modules and start accessing BigQuery through Python objects.
Install Required Modules
Use the pip utility to install the required modules and frameworks:
pip install pandas
pip install dash
pip install dash-daq
Visualize BigQuery Data in Python
Once the required modules and frameworks are installed, we are ready to build our web app. Code snippets follow, but the full source code is available at the end of the article.
First, be sure to import the modules (including the CData Connector) with the following:
import os
import dash
import dash_core_components as dcc
import dash_html_components as html
import pandas as pd
import cdata.googlebigquery as mod
import plotly.graph_objs as go
You can now connect with a connection string. Use the connect function for the CData BigQuery Connector to create a connection for working with BigQuery data.
cnxn = mod.connect("DataSetId=MyDataSetId;ProjectId=MyProjectId;InitiateOAuth=GETANDREFRESH;OAuthSettingsLocation=/PATH/TO/OAuthSettings.txt")")
Execute SQL to BigQuery
Use the read_sql function from pandas to execute any SQL statement and store the result set in a DataFrame.
df = pd.read_sql("SELECT OrderName, Freight FROM Orders WHERE ShipCity = 'New York'", cnxn)
Configure the Web App
With the query results stored in a DataFrame, we can begin configuring the web app, assigning a name, stylesheet, and title.
app_name = 'dash-googlebigqueryedataplot'

external_stylesheets = ['https://codepen.io/chriddyp/pen/bWLwgP.css']

app = dash.Dash(__name__, external_stylesheets=external_stylesheets)
app.title = 'CData + Dash'
Configure the Layout
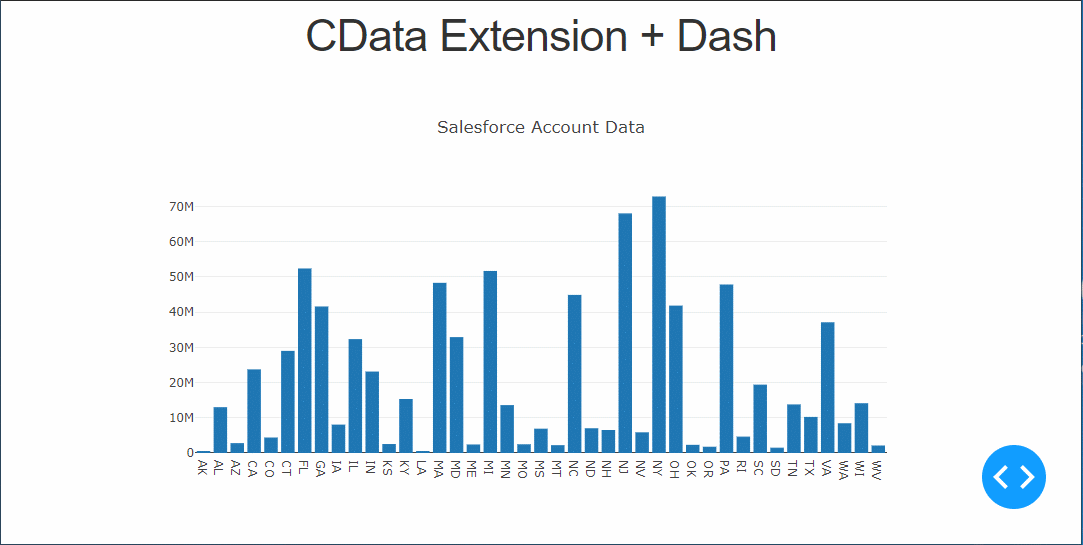
The next step is to create a bar graph based on our BigQuery data and configure the app layout.
trace = go.Bar(x=df.OrderName, y=df.Freight, name='OrderName')

app.layout = html.Div(children=[html.H1("CData Extension + Dash", style={'textAlign': 'center'}),
	dcc.Graph(
		id='example-graph',
		figure={
			'data': [trace],
			'layout':
			go.Layout(title='BigQuery Orders Data', barmode='stack')
		})
], className="container")
Set the App to Run
With the connection, app, and layout configured, we are ready to run the app. The last lines of Python code follow.
if __name__ == '__main__':
    app.run_server(debug=True)
Now, use Python to run the web app and a browser to view the BigQuery data.
python googlebigquery-dash.py

Free Trial & More Information
Download a free, 30-day trial of the CData Python Connector for Google BigQuery to start building Python apps with connectivity to BigQuery data. Reach out to our Support Team if you have any questions.
Full Source Code
import os
import dash
import dash_core_components as dcc
import dash_html_components as html
import pandas as pd
import cdata.googlebigquery as mod
import plotly.graph_objs as go

cnxn = mod.connect("DataSetId=MyDataSetId;ProjectId=MyProjectId;InitiateOAuth=GETANDREFRESH;OAuthSettingsLocation=/PATH/TO/OAuthSettings.txt")

df = pd.read_sql("SELECT OrderName, Freight FROM Orders WHERE ShipCity = 'New York'", cnxn)
app_name = 'dash-googlebigquerydataplot'

external_stylesheets = ['https://codepen.io/chriddyp/pen/bWLwgP.css']

app = dash.Dash(__name__, external_stylesheets=external_stylesheets)
app.title = 'CData + Dash'
trace = go.Bar(x=df.OrderName, y=df.Freight, name='OrderName')

app.layout = html.Div(children=[html.H1("CData Extension + Dash", style={'textAlign': 'center'}),
	dcc.Graph(
		id='example-graph',
		figure={
			'data': [trace],
			'layout':
			go.Layout(title='BigQuery Orders Data', barmode='stack')
		})
], className="container")

if __name__ == '__main__':
    app.run_server(debug=True)

