Model Context Protocol (MCP) finally gives AI models a way to access the business data needed to make them really useful at work. CData MCP Servers have the depth and performance to make sure AI has access to all of the answers.
Try them now for free →Import and Visualize Databricks Data in Power View
Create data visualizations based on Databricks data in Excel.
NOTE: For Excel for the web (Excel 365) and Excel 2019 or higher, Power View is no longer supported. Microsoft encourages the use of Power BI for those users. Please read our article on working with Databricks in Power BI using our Power BI connector for more information.
You can use the built-in ODBC support in Excel to rapidly create Power View reports featuring Databricks data. This article shows how to use the Data Connection Wizard, accessible from the Data ribbon, to import Databricks data into a Power View report.
Connect to Databricks as an ODBC Data Source
If you have not already, first specify connection properties in an ODBC DSN (data source name). This is the last step of the driver installation. You can use the Microsoft ODBC Data Source Administrator to create and configure ODBC DSNs.
To connect to a Databricks cluster, set the properties as described below.
Note: The needed values can be found in your Databricks instance by navigating to Clusters, and selecting the desired cluster, and selecting the JDBC/ODBC tab under Advanced Options.
- Server: Set to the Server Hostname of your Databricks cluster.
- HTTPPath: Set to the HTTP Path of your Databricks cluster.
- Token: Set to your personal access token (this value can be obtained by navigating to the User Settings page of your Databricks instance and selecting the Access Tokens tab).
When you configure the DSN, you may also want to set the Max Rows connection property. This will limit the number of rows returned, which is especially helpful for improving performance when designing reports and visualizations.
About Databricks Data Integration
Accessing and integrating live data from Databricks has never been easier with CData. Customers rely on CData connectivity to:
- Access all versions of Databricks from Runtime Versions 9.1 - 13.X to both the Pro and Classic Databricks SQL versions.
- Leave Databricks in their preferred environment thanks to compatibility with any hosting solution.
- Secure authenticate in a variety of ways, including personal access token, Azure Service Principal, and Azure AD.
- Upload data to Databricks using Databricks File System, Azure Blog Storage, and AWS S3 Storage.
While many customers are using CData's solutions to migrate data from different systems into their Databricks data lakehouse, several customers use our live connectivity solutions to federate connectivity between their databases and Databricks. These customers are using SQL Server Linked Servers or Polybase to get live access to Databricks from within their existing RDBMs.
Read more about common Databricks use-cases and how CData's solutions help solve data problems in our blog: What is Databricks Used For? 6 Use Cases.
Getting Started
Connect with the Data Connection Wizard
Follow the steps below to connect to the DSN from the Data Connection Wizard in Excel.
- In recent versions of Excel the Data Connection Wizard is not visible by default. To enable the Data Connection Wizard in Excel, go to File -> Options -> Data and under Show legacy data import wizards check the From Data Connection Wizard (Legacy).
- After enabling the Data Connection Wizard, on the Data tab you can click Get Data -> Legacy Wizards -> From Data Connection Wizard (Legacy).
- In the Data Connection Wizard, select the ODBC DSN option.
- Select the ODBC DSN for Databricks from the list.
Select the tables you want to work with.
If you want to import multiple tables, deselect the "Connect to a specific table" option. After you connect to the data source, you can select multiple tables: After you click Finish to close the Data Connection Wizard, select the "Enable selection of multiple tables" option in the Select Table dialog.
- In the Import Data dialog, select the destination for your data. For example, select the Table option and the Existing worksheet option. Then click the cell in your worksheet where results should be output.
- Click Insert -> Power View to create a new Power View report.
Create a Table
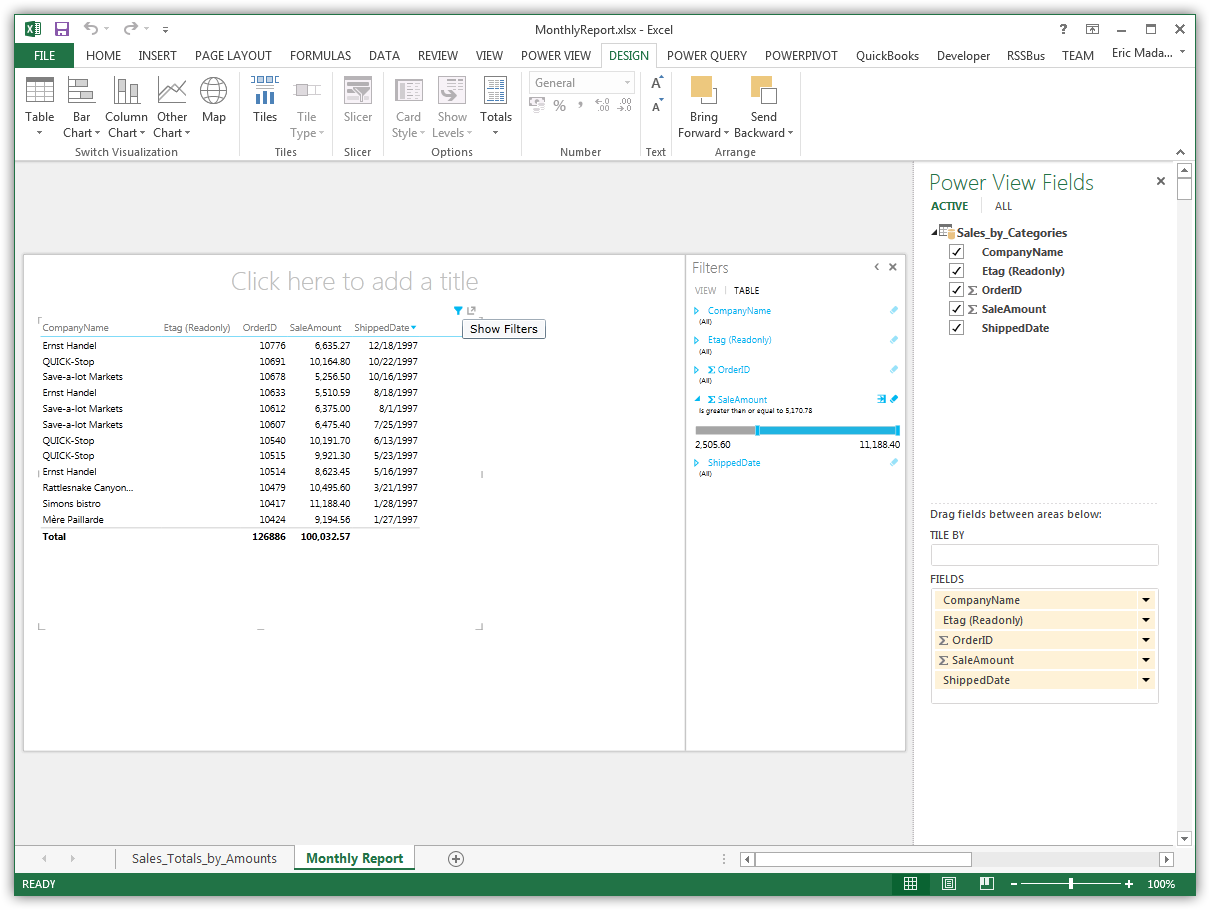
Tables are the starting point for charts and other representations of your data. To create a table, select a column in the field list. You can also drag and drop table names and column names onto the view.

Create Data Visualizations
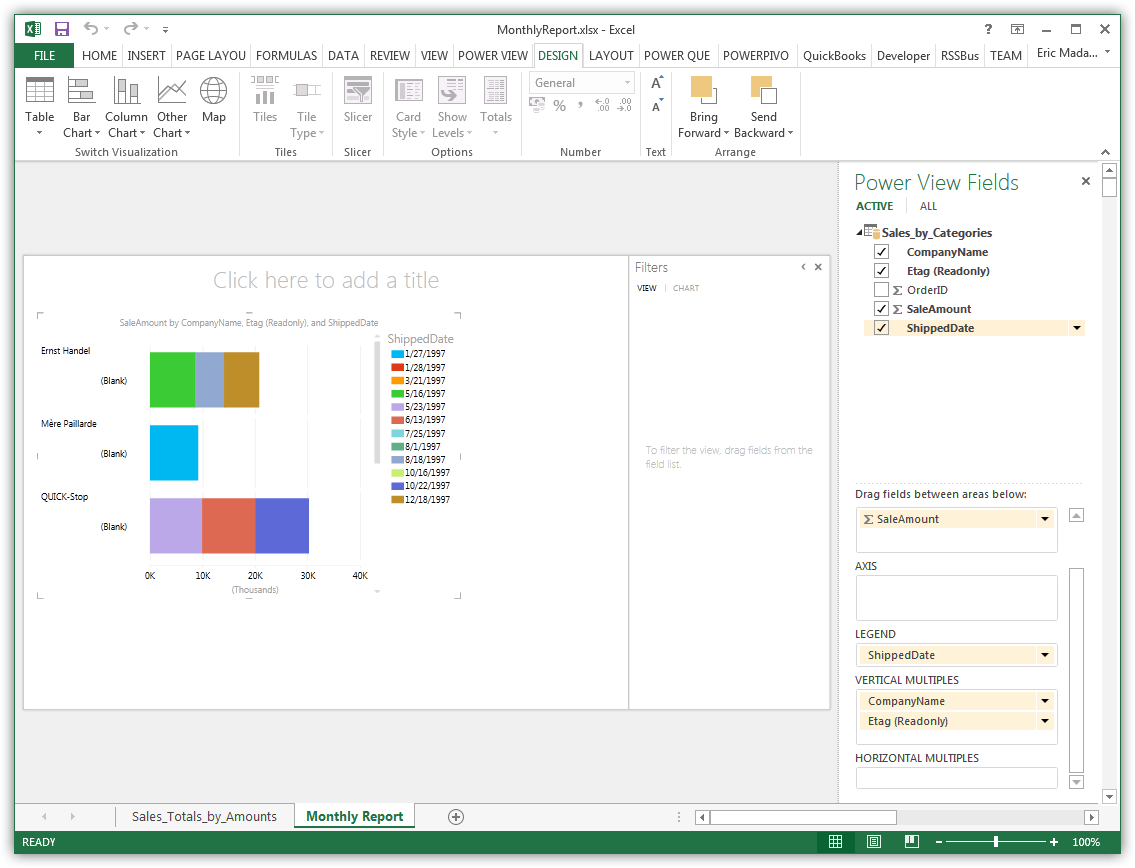
On the Design tab, you can change tables into charts and other visualizations.


