Model Context Protocol (MCP) finally gives AI models a way to access the business data needed to make them really useful at work. CData MCP Servers have the depth and performance to make sure AI has access to all of the answers.
Try them now for free →DataBind Elasticsearch Data to the DevExpress Data Grid
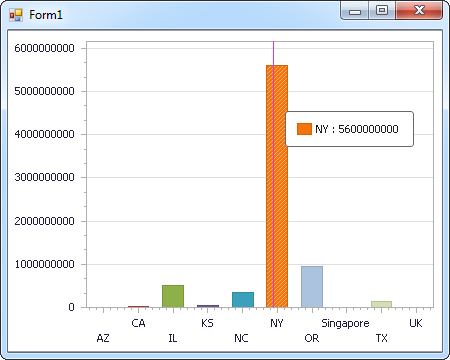
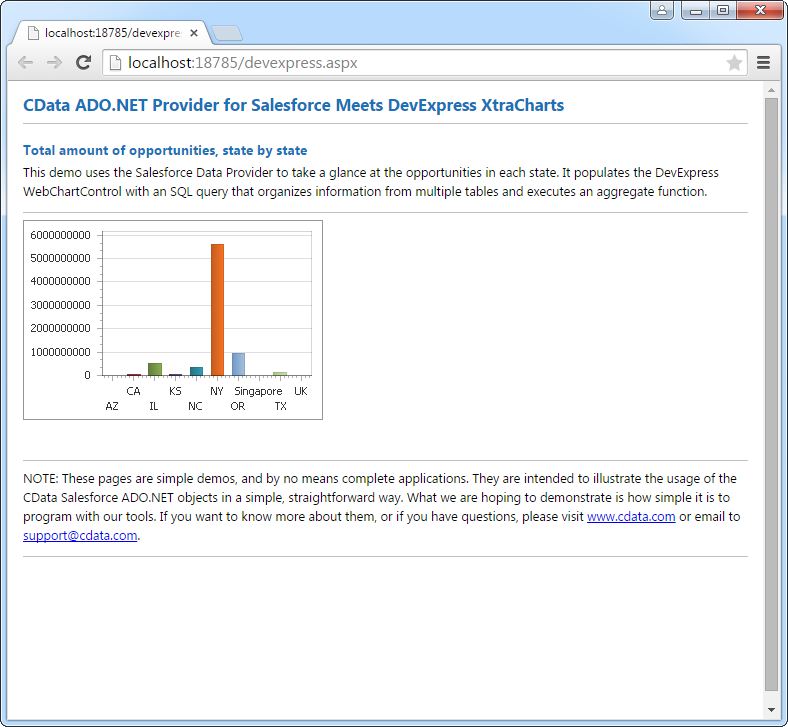
Use the CData ADO.NET Provider for Elasticsearch with the DevExpress Windows Forms and Web controls to provide Elasticsearch data to a chart.
The ADO.NET Provider for Elasticsearch by CData incorporates conventional ADO.NET data access components compatible with third-party controls. You can adhere to the standard ADO.NET data binding procedures to establish two-way access to real-time data through UI controls. This article will demonstrate the utilization of CData components for data binding with DevExpress UI Controls (Windows Forms and Web controls), specifically binding to a chart that visualizes live data.
About Elasticsearch Data Integration
Accessing and integrating live data from Elasticsearch has never been easier with CData. Customers rely on CData connectivity to:
- Access both the SQL endpoints and REST endpoints, optimizing connectivity and offering more options when it comes to reading and writing Elasticsearch data.
- Connect to virtually every Elasticsearch instance starting with v2.2 and Open Source Elasticsearch subscriptions.
- Always receive a relevance score for the query results without explicitly requiring the SCORE() function, simplifying access from 3rd party tools and easily seeing how the query results rank in text relevance.
- Search through multiple indices, relying on Elasticsearch to manage and process the query and results instead of the client machine.
Users frequently integrate Elasticsearch data with analytics tools such as Crystal Reports, Power BI, and Excel, and leverage our tools to enable a single, federated access layer to all of their data sources, including Elasticsearch.
For more information on CData's Elasticsearch solutions, check out our Knowledge Base article: CData Elasticsearch Driver Features & Differentiators.
Getting Started
Set the Server and Port connection properties to connect. To authenticate, set the User and Password properties, PKI (public key infrastructure) properties, or both. To use PKI, set the SSLClientCert, SSLClientCertType, SSLClientCertSubject, and SSLClientCertPassword properties.
The data provider uses X-Pack Security for TLS/SSL and authentication. To connect over TLS/SSL, prefix the Server value with 'https://'. Note: TLS/SSL and client authentication must be enabled on X-Pack to use PKI.
Once the data provider is connected, X-Pack will then perform user authentication and grant role permissions based on the realms you have configured.
Windows Forms Controls
The code below shows how to populate a DevExpress chart with Elasticsearch data. The ElasticsearchDataAdapter binds to the Series property of the chart control. The Diagram property of the control defines the x- and y-axes as the column names.
using (ElasticsearchConnection connection = new ElasticsearchConnection(
"Server=127.0.0.1;Port=9200;User=admin;Password=123456;")) {
  ElasticsearchDataAdapter dataAdapter = new ElasticsearchDataAdapter(
  "SELECT Orders.Freight, Customers.ContactName FROM Customers INNER JOIN Orders ON Customers.CustomerId=Orders.CustomerId", connection);

  DataTable table = new DataTable();
  dataAdapter.Fill(table);
  DevExpress.XtraCharts.Series series = new DevExpress.XtraCharts.Series();
  chartControl1.Series.Add(series);
  series.DataSource = table;
  series.ValueDataMembers.AddRange(new string[] { "Freight" });
  series.ArgumentScaleType = DevExpress.XtraCharts.ScaleType.Qualitative;
  series.ArgumentDataMember = "OrderName";
  series.ValueScaleType = DevExpress.XtraCharts.ScaleType.Numerical;
  chartControl1.Legend.Visibility = DevExpress.Utils.DefaultBoolean.False;
  ((DevExpress.XtraCharts.SideBySideBarSeriesView)series.View).ColorEach = true;
}

Web Controls
The code below shows how to populate a DevExpress Web control with Elasticsearch data. The ElasticsearchDataAdapter binds to the Series property of the chart; the Diagram property defines the x- and y-axes as the column names.
using DevExpress.XtraCharts;

using (ElasticsearchConnection connection = new ElasticsearchConnection(
"Server=127.0.0.1;Port=9200;User=admin;Password=123456;"))
{
  ElasticsearchDataAdapter ElasticsearchDataAdapter1 = new ElasticsearchDataAdapter("SELECT Orders.Freight, Customers.ContactName FROM Customers INNER JOIN Orders ON Customers.CustomerId=Orders.CustomerId", connection);
  DataTable table = new DataTable();
  ElasticsearchDataAdapter1.Fill(table);
  DevExpress.XtraCharts.Series series = new Series("Series1", ViewType.Bar);
  WebChartControl1.Series.Add(series);
  series.DataSource = table;
  series.ValueDataMembers.AddRange(new string[] { "Freight" });
  series.ArgumentScaleType = ScaleType.Qualitative;
  series.ArgumentDataMember = "OrderName";
  series.ValueScaleType = ScaleType.Numerical;
  ((DevExpress.XtraCharts.SideBySideBarSeriesView)series.View).ColorEach = true;
}


