Model Context Protocol (MCP) finally gives AI models a way to access the business data needed to make them really useful at work. CData MCP Servers have the depth and performance to make sure AI has access to all of the answers.
Try them now for free →DataBind Wijmo Grid to Google Analytics Data
Provide real-time Google Analytics data to interactive controls.
The API Server, when paired with the ADO.NET Provider for Google Analytics (or any of 200+ other ADO.NET Providers), provides Google Analytics data as Web services, which enable connectivity to live data. This article shows how to consume JSONP-formatted Google Analytics data from a Wijmo Grid.
Set Up the API Server
Follow the steps below to begin producing secure Google Analytics OData services:
Deploy
The API Server runs on your own server. On Windows, you can deploy using the stand-alone server or IIS. On a Java servlet container, drop in the API Server WAR file. See the help documentation for more information and how-tos.
The API Server is also easy to deploy on Microsoft Azure, Amazon EC2, and Heroku.
Connect to Google Analytics
After you deploy the API Server and the ADO.NET Provider for Google Analytics, provide authentication values and other connection properties needed to connect to Google Analytics by clicking Settings -> Connections and adding a new connection in the API Server administration console.
Google uses the OAuth authentication standard. To access Google APIs on behalf on individual users, you can use the embedded credentials or you can register your own OAuth app.
OAuth also enables you to use a service account to connect on behalf of users in a Google Apps domain. To authenticate with a service account, register an application to obtain the OAuth JWT values.
In addition to the OAuth values, set Profile to the profile you want to connect to. This can be set to either the Id or website URL for the Profile. If not specified, the first Profile returned will be used.
You can then choose the Google Analytics entities you want to allow the API Server to access by clicking Settings -> Resources. This article uses Traffic as an example.
Authorize API Server Users
After determining the OData services you want to produce, authorize users by clicking Settings -> Users. The API Server uses authtoken-based authentication and supports the major authentication schemes. Access can also be restricted based on IP address; by default only connections to the local machine are allowed. You can authenticate as well as encrypt connections with SSL.
Create a Real-Time Grid
Follow the steps below to consume Google Analytics data from the Wijmo JavaScript controls:
- Load the required Wijmo, jQuery, and Knockout libraries:
<script src="http://code.jquery.com/jquery-1.11.1.min.js"></script>
<script src="http://code.jquery.com/ui/1.11.0/jquery-ui.min.js"></script>

<!--Theme-->
<link href="http://cdn.wijmo.com/themes/aristo/jquery-wijmo.css" rel="stylesheet" type="text/css">

<!--Wijmo Widgets CSS-->
<link href="http://cdn.wijmo.com/jquery.wijmo-pro.all.3.20161.90.min.css" rel="stylesheet" type="text/css">

<!--Wijmo Widgets JavaScript-->
<script src="http://cdn.wijmo.com/jquery.wijmo-open.all.3.20161.90.min.js"></script>
<script src="http://cdn.wijmo.com/jquery.wijmo-pro.all.3.20161.90.min.js"></script>
<script src="http://cdn.wijmo.com/interop/wijmo.data.ajax.3.20161.90.js"></script>

<!--Knockout JS Library-->
<!-- Both of the links below can work -->
<script src="http://cdn.wijmo.com/wijmo/external/knockout-2.2.0.js"></script>
<!--<script src="http://cdn.wijmo.com/amd-js/3.20161.90/knockout-3.1.0.js"></script>-->

<!--Wijmo Knockout Integration Library-->
<script src="http://cdn.wijmo.com/interop/knockout.wijmo.3.20161.90.js"></script>
-
Create a ViewModel and connect to it using the ODataView. You will need to replace the placeholder values for the URL of the API Server, an API Server user, and the authtoken for that user.
<script id="scriptInit"> $.support.cors = true; var viewModel; function ViewModel() { var trafficView = new wijmo.data.ODataView("http://MyServer:MyPort/api.rsc/Traffic", { ajax: { dataType: "jsonp", username: "MyUser", password: "MyAuthtoken", data: { "$inlinecount": null } }, pageSize: 10 }); trafficView.refresh(); trafficView.nextPage(); this.traffic = trafficView; this.prevPage = function () {trafficView.prevPage();}; this.nextPage = function () {trafficView.nextPage();}; } $(document).ready(function () { viewModel = new ViewModel(); ko.applyBindings(viewModel, $(".container").get(0)); }); </script> -
DataBind: Below is a simple table with some paging buttons, which you can paste into the body section of your markup.
<h2>Connect to Live Google Analytics Data in Real Time</h2>

<h3>Traffic</h3>
<div>
  <button title="previous page" class="pagebuttons" data-bind="click: prevPage, button: {}"><span class="ui-icon ui-icon-seek-prev" /></button>
  <button title="next page" class="pagebuttons" data-bind="click: nextPage, button: {}"><span class="ui-icon ui-icon-seek-next" /></button>
</div>
<table id="demo-grid" data-bind="wijgrid: {
  data: traffic,
  showFilter: true,
  allowPaging: true,
  pagerSettings: { position: 'none'},
  columnsAutogenerationMode: 'append',
}" >
</table>
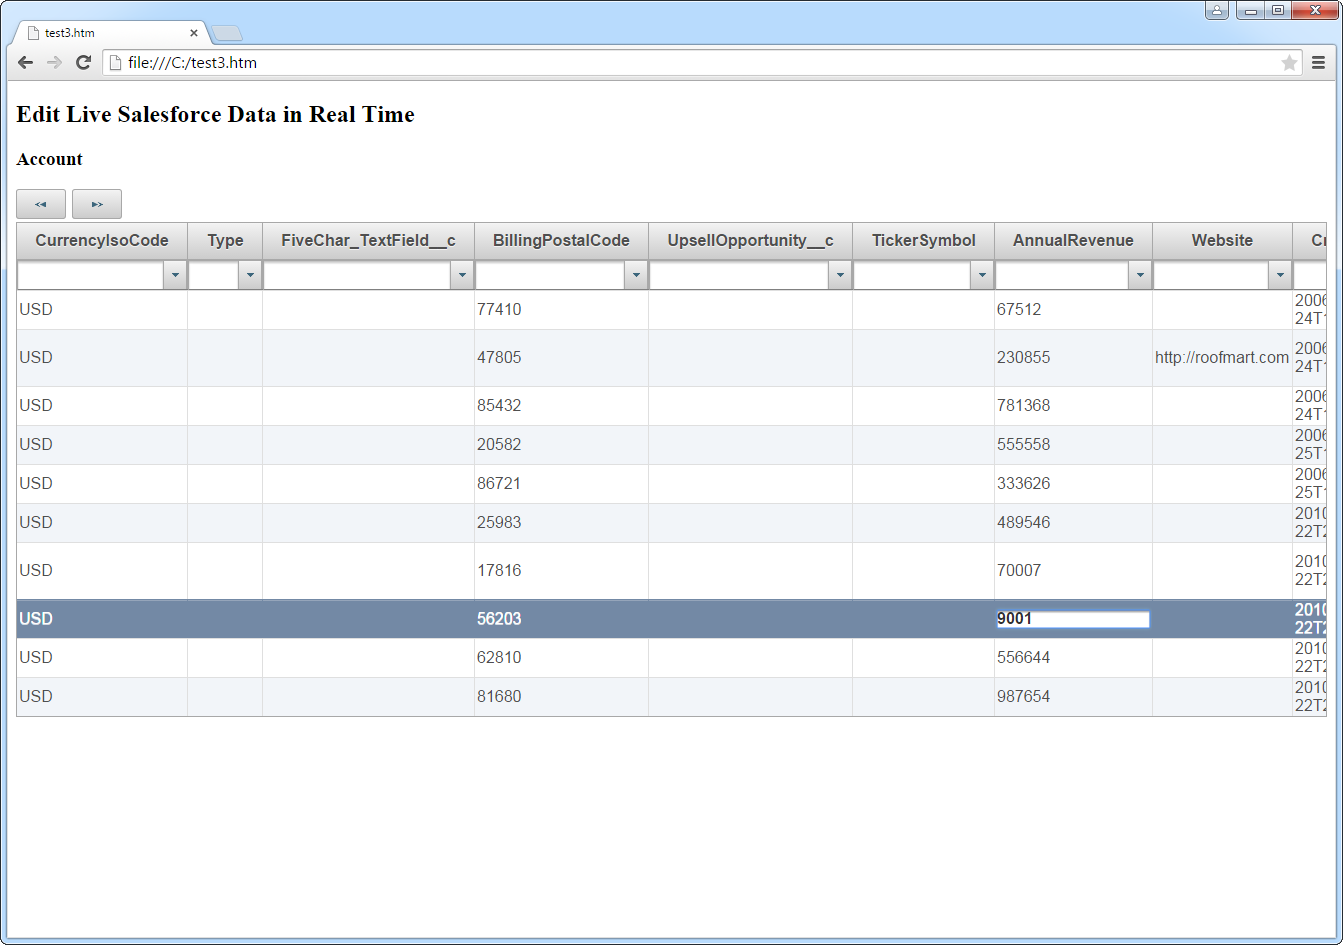
Below is the resulting grid. You can filter and sort through pages of Google Analytics data.

