Model Context Protocol (MCP) finally gives AI models a way to access the business data needed to make them really useful at work. CData MCP Servers have the depth and performance to make sure AI has access to all of the answers.
Try them now for free →Analyze Printify Data in Infragistics Reveal
Use the CData Connect Server to create an OData API on top of Printify data and visualize live Printify data in Ingragistics Reveal.
Reveal is a data visualization solution provided by Infragistics and can be paired with the CData Connect Server and Printify Connector to build dynamic dashboards from live Printify data. The CData Connect Server creates a virtual database for Printify and can be used to generate an OData API (natively consumable in Reveal) for Printify. In this article, we walk through connecting to Printify in Connect Server and connecting to Connect Server from Infragistics Reveal to create a simple dashboard.
Add a Connect Server User
Create a User to connect to Printify from Reveal through Connect Server.
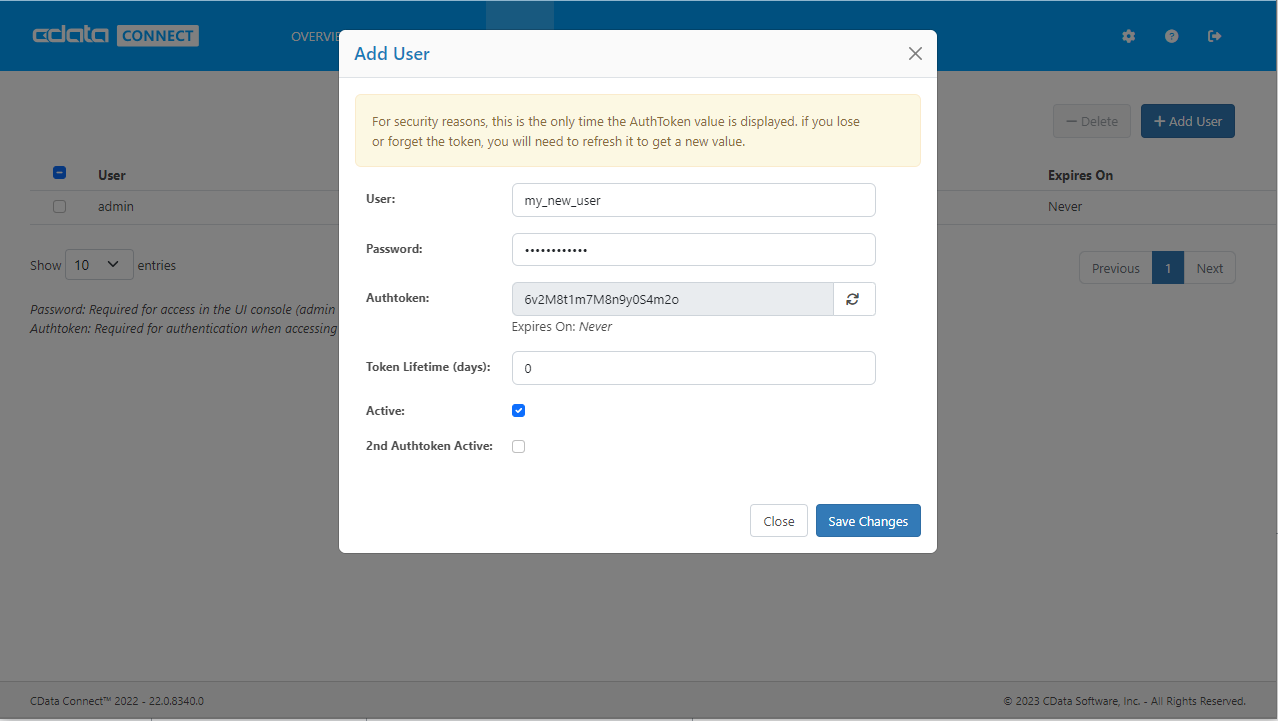
- Click Users -> Add
- Configure a User
![Creating a new user]()
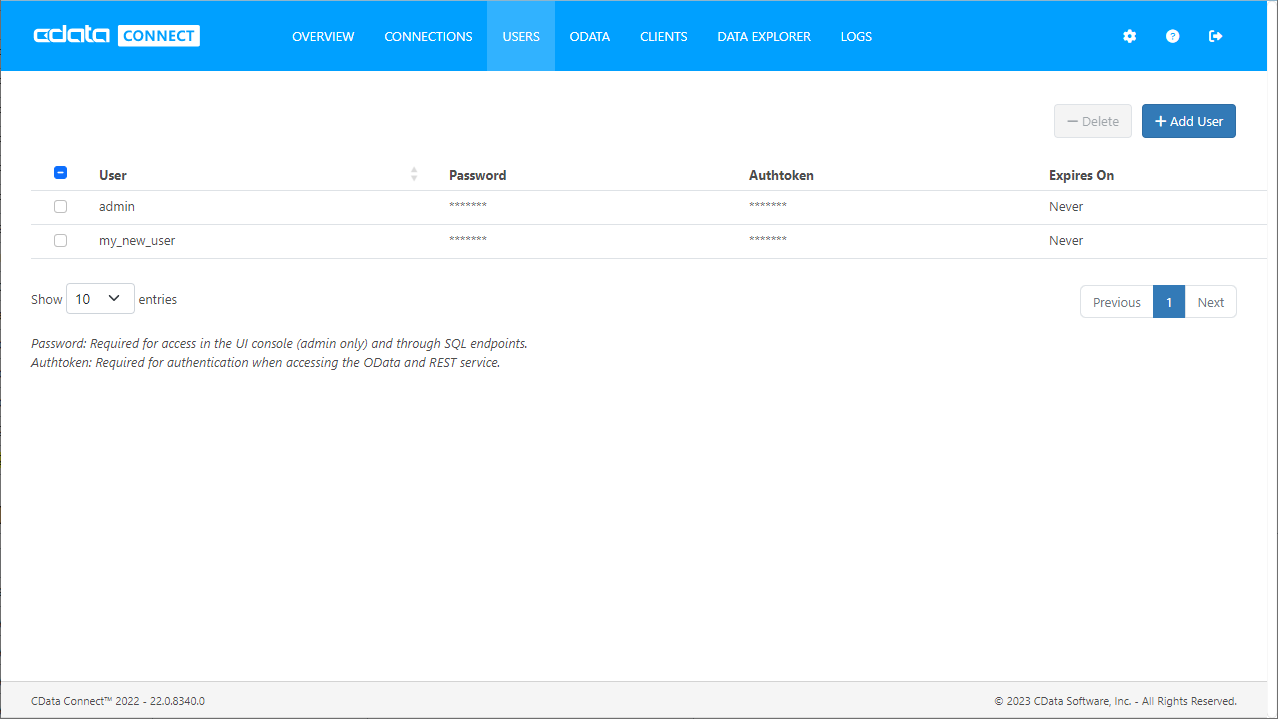
- Click Save Changes and make note of the Authtoken for the new user
![Connect Server users]()
Connect to Printify from Connect Server
CData Connect Server uses a straightforward, point-and-click interface to connect to data sources and generate APIs.
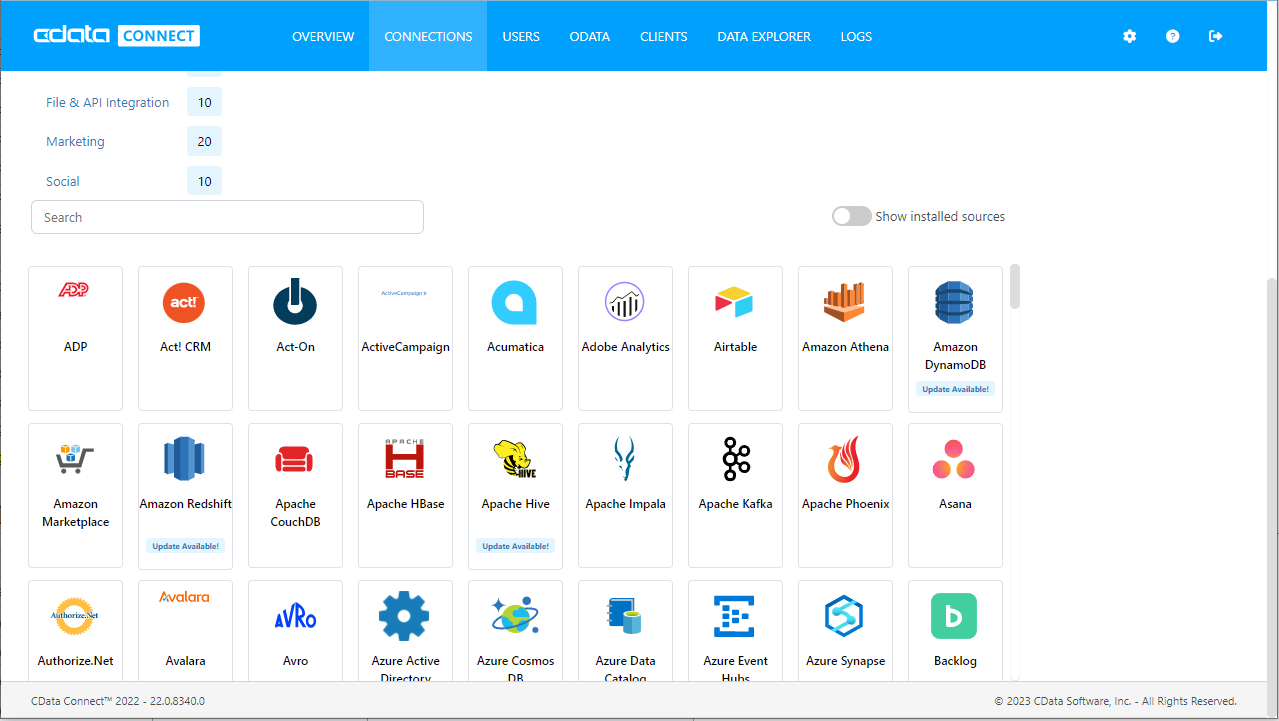
- Open Connect Server and click Connections
![Adding a connection]()
- Select "Printify" from Available Data Sources
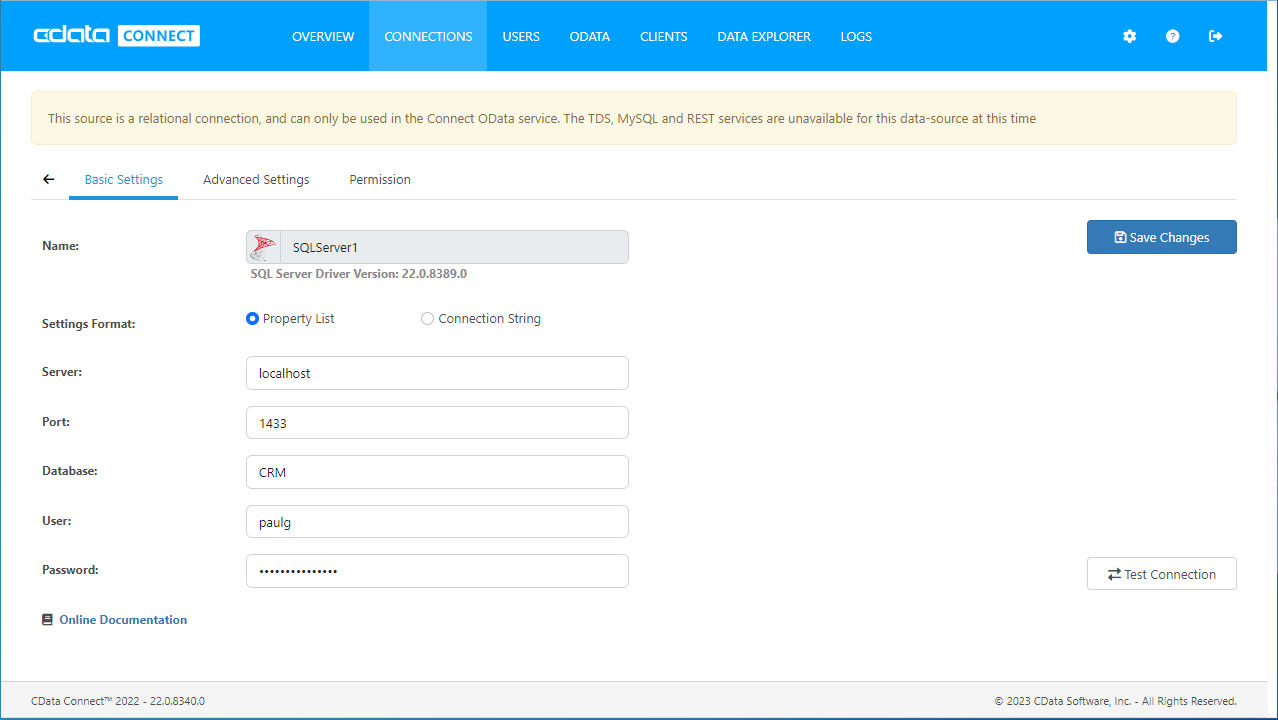
- Enter the necessary authentication properties to connect to Printify.
Start by setting the Profile connection property to the location of the Printify Profile on disk (e.g. C:\profiles\Profile.apip). Next, set the ProfileSettings connection property to the connection string for Printify (see below).
Printify API Profile Settings
In order to authenticate to Printify, you'll need to provide your API Key. To get your API Key navigate to My Profile, then Connections. In the Connections section you will be able to generate your Personal Access Token (API Key) and set your Token Access Scopes. Personal Access Tokens are valid for one year. An expired Personal Access Token can be re-generated using the same steps after it expires. Set the API Key to your Personal Access Token in the ProfileSettings property to connect.
![Configuring a connection (SQL Server is shown).]()
- Click Save Changes
- Click Privileges -> Add and add the new user (or an existing user) with the appropriate permissions (SELECT is all that is required for Reveal).
Add Printify OData Endpoints in Connect Server
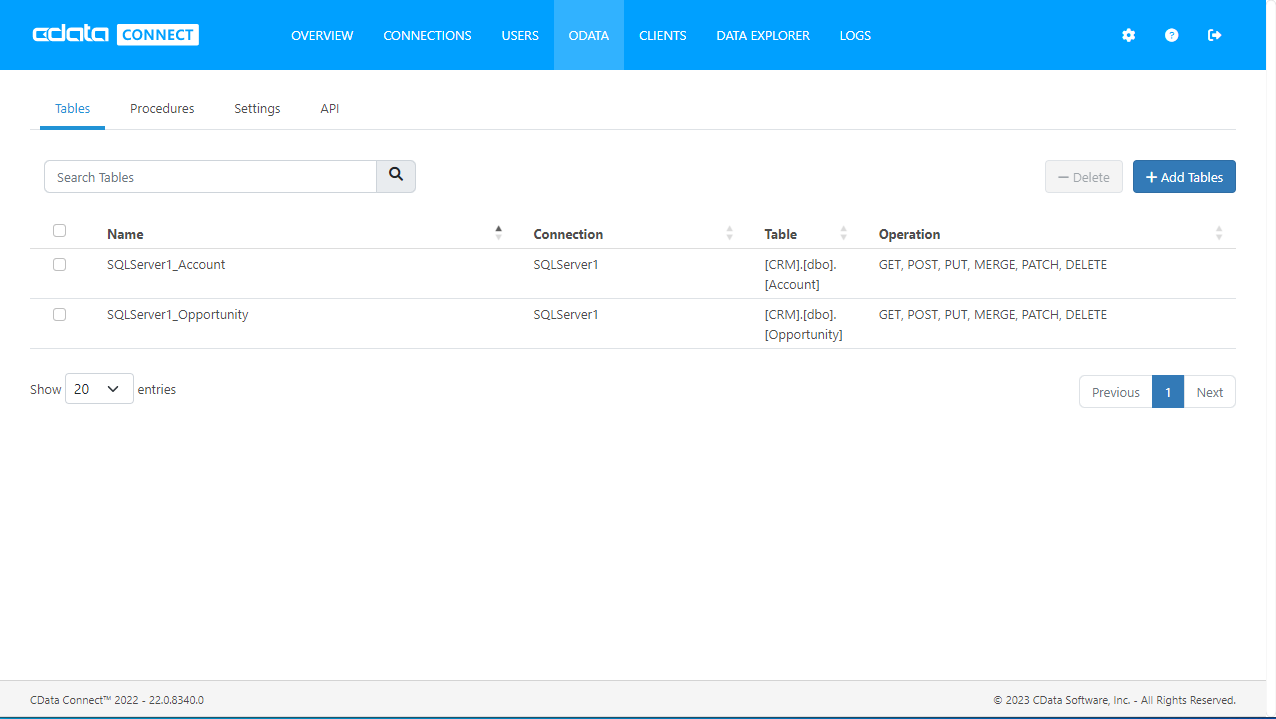
After connecting to Printify, create OData Endpoint for the desired table(s).
- Click OData -> Tables -> Add Tables
![Adding a new resource]()
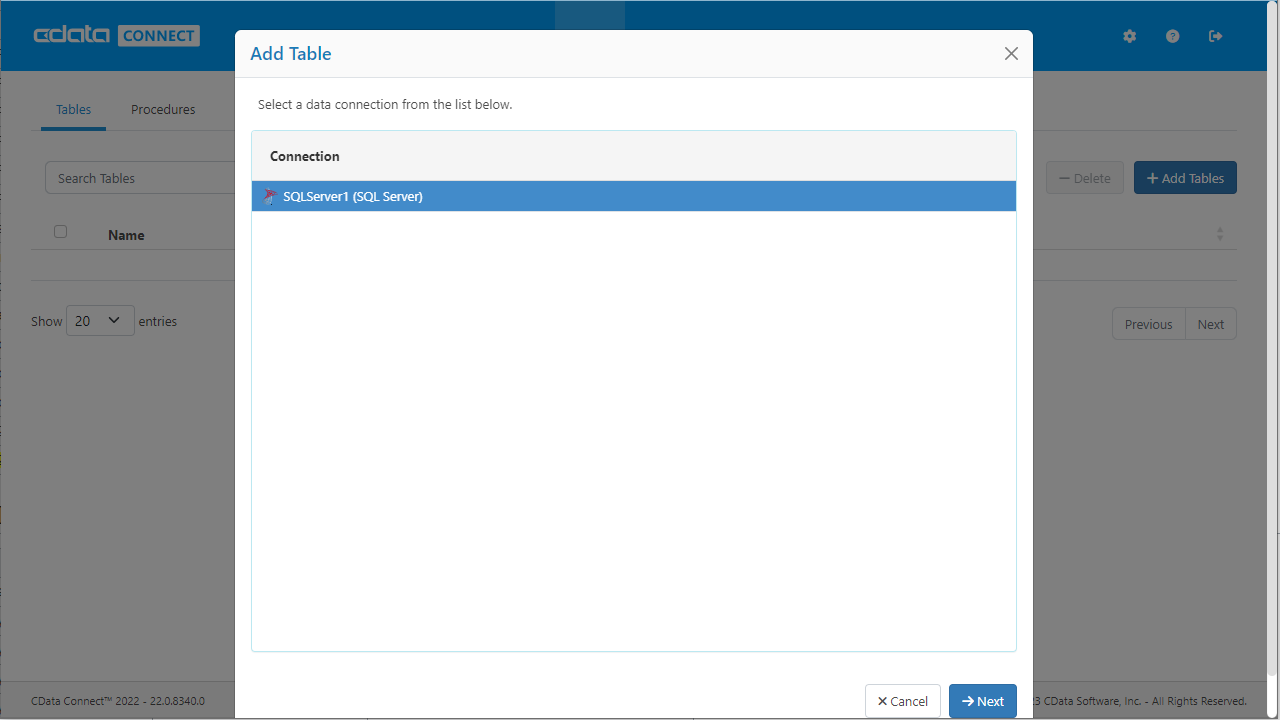
- Select the Printify database
![Selecting a connection (SQL Server is shown)]()
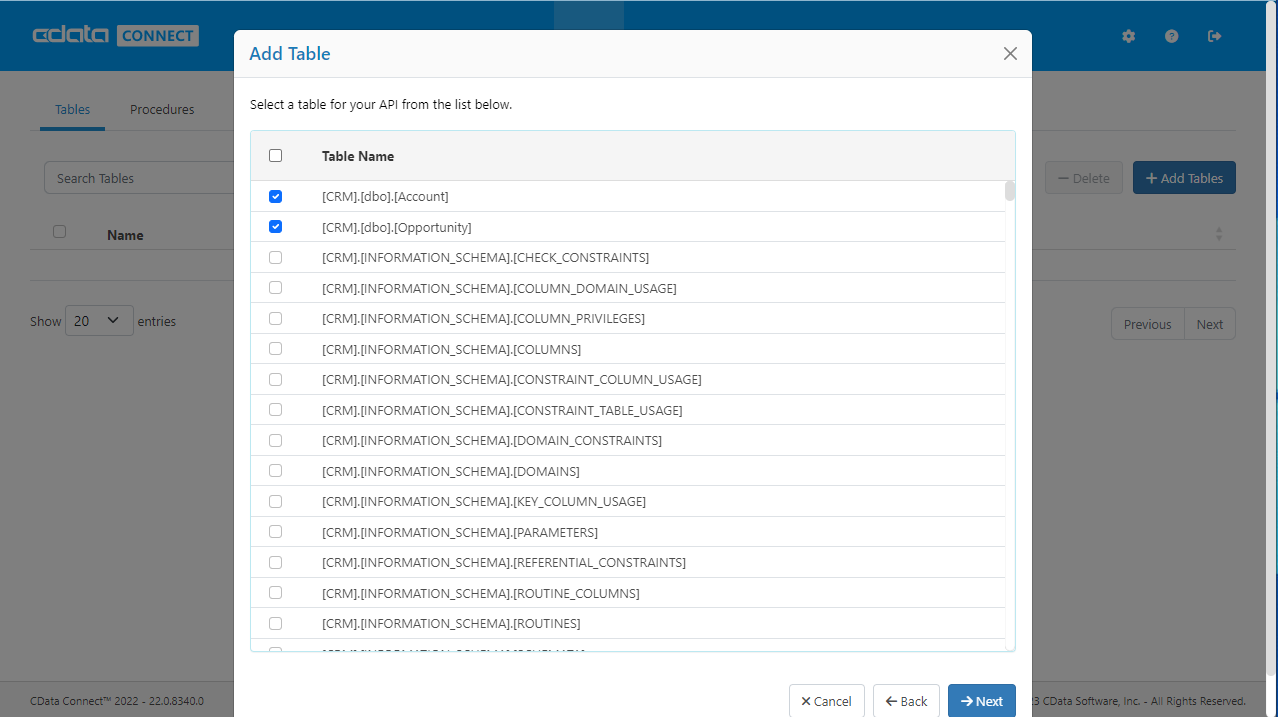
- Select the table(s) you wish to work with and click Next
![Selecting a Table (SQL Server is shown)]()
- (Optional) Edit the resource to select specific fields and more
- Save the settings
(Optional) Configure Cross-Origin Resource Sharing (CORS)
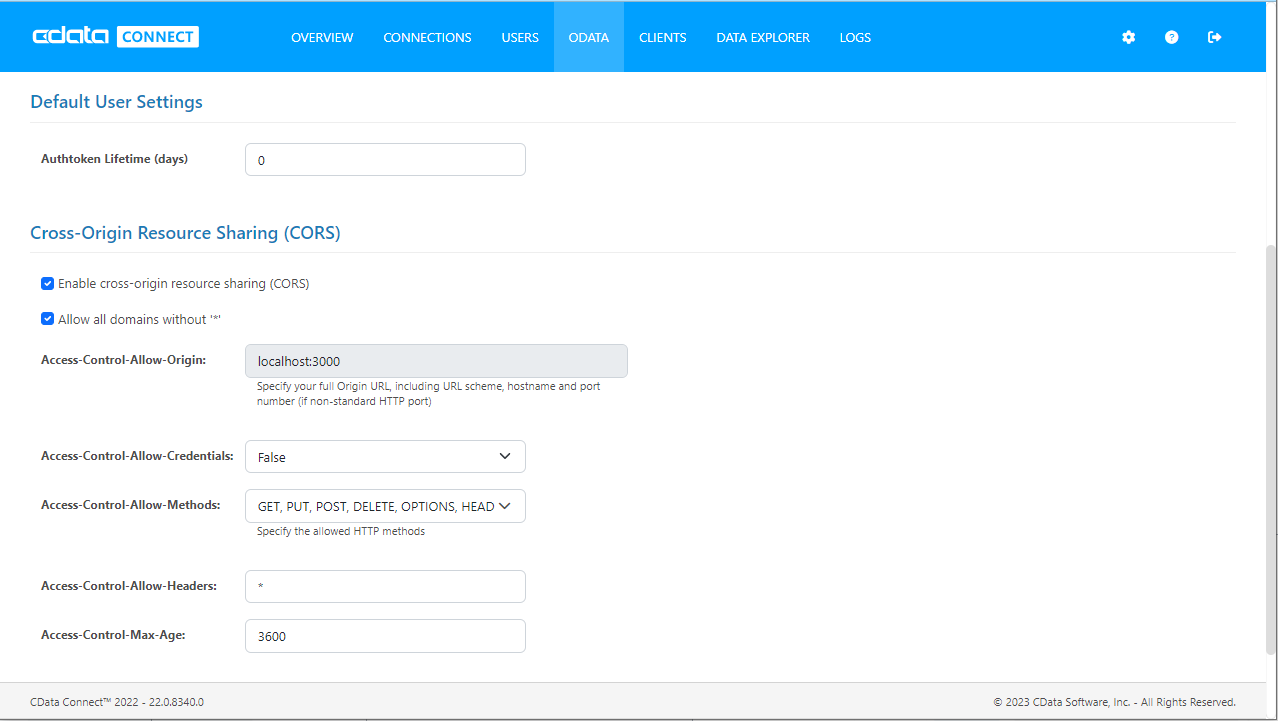
When accessing and connecting to multiple different domains from an application such as Ajax, there is a possibility of violating the limitations of cross-site scripting. In that case, configure the CORS settings in OData -> Settings.
- Enable cross-origin resource sharing (CORS): ON
- Allow all domains without '*': ON
- Access-Control-Allow-Methods: GET, PUT, POST, OPTIONS
- Access-Control-Allow-Headers: Authorization
Save the changes to the settings.
Create a Dashboard in Reveal
With Connect Server configured, we can visualize Printify data in Reveal.
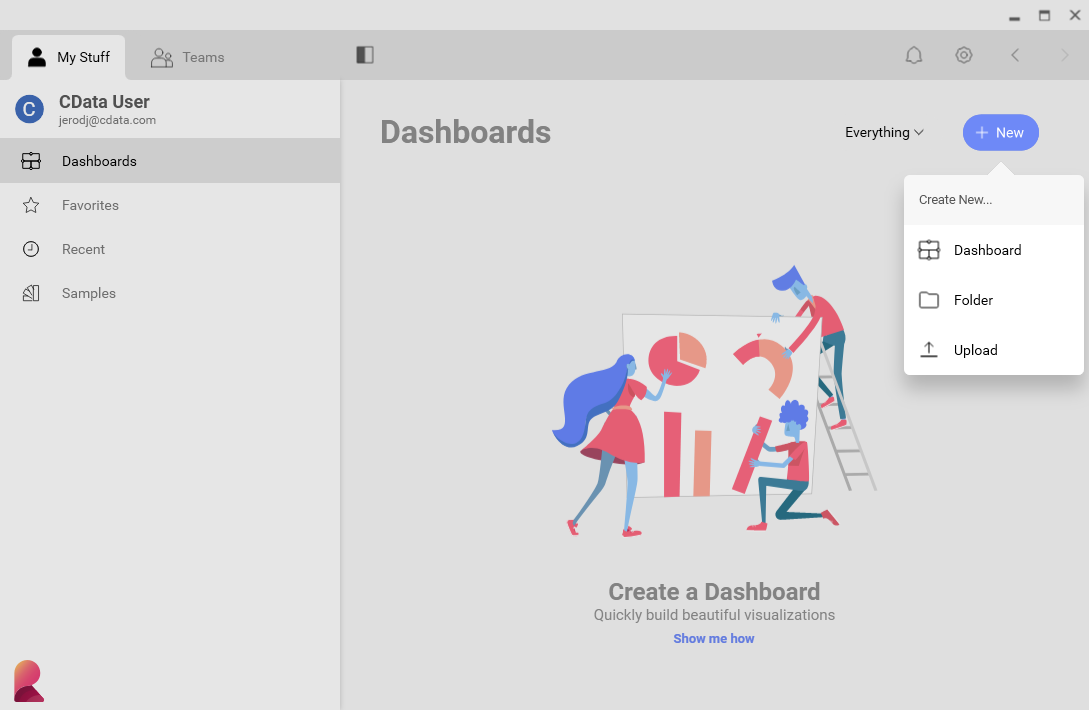
- Log into Reveal and click Dashboards -> New
![Adding a new dashboard]()
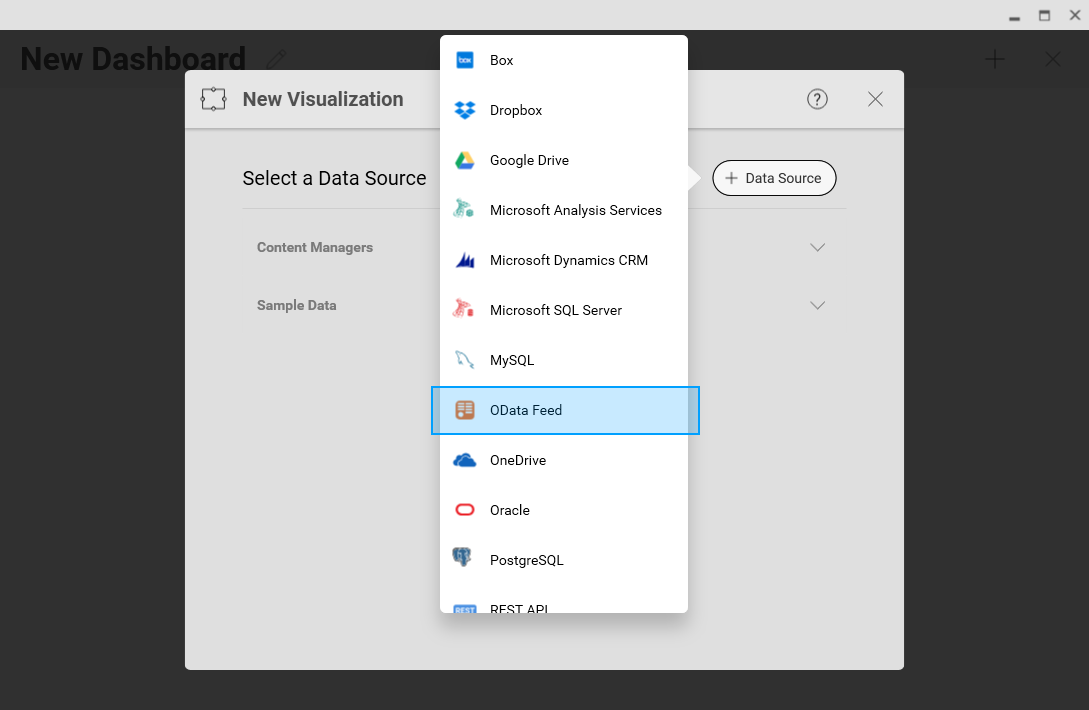
- Click Data Source -> OData Feed
![Adding a new OData data source]()
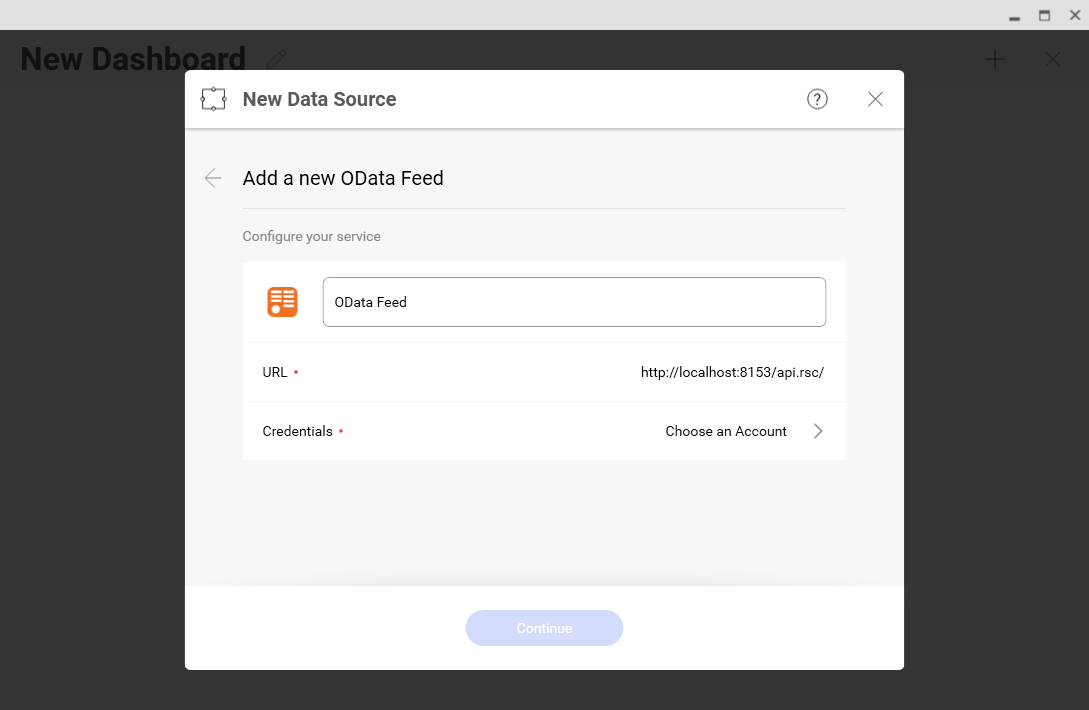
- Specify the Connect Server API endpoint URL (found in API -> Discovery -> Base URL), for example: CONNECT_SERVER_URL/api.rsc
![Configuring the OData URL]()
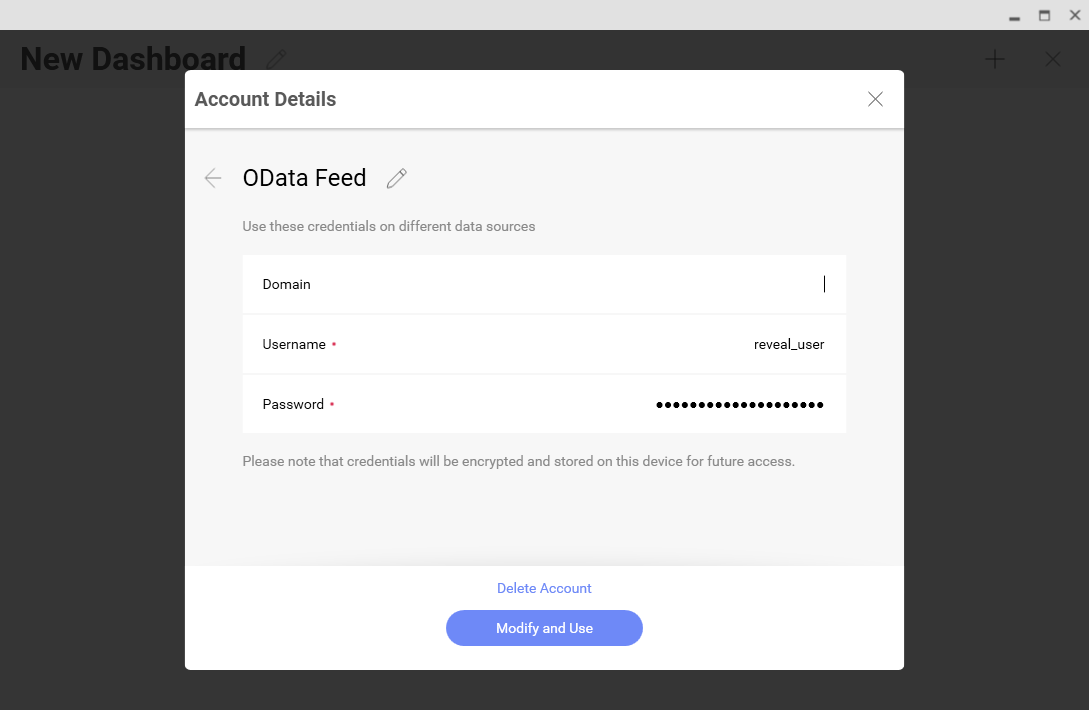
- Select Generic Credentials and specify the Connect Server username and authentication token
![Configuring the credentials]()
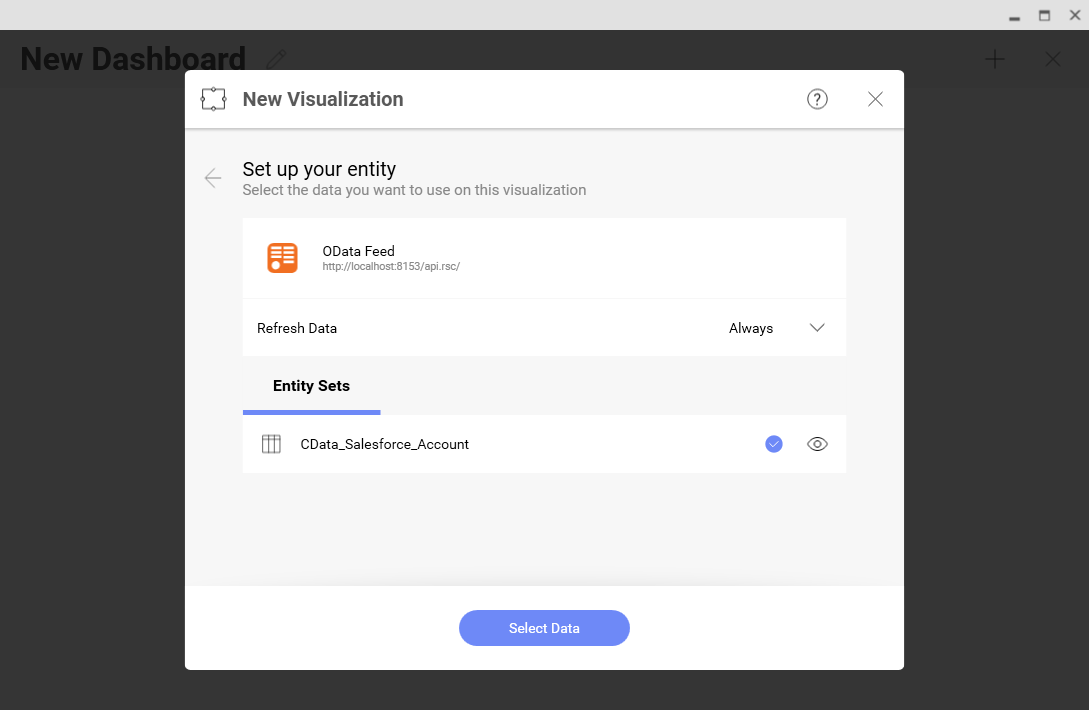
- Select the entity you wish to visualize
![Selecting an entity to visualize (SQL Server is shown.)]()
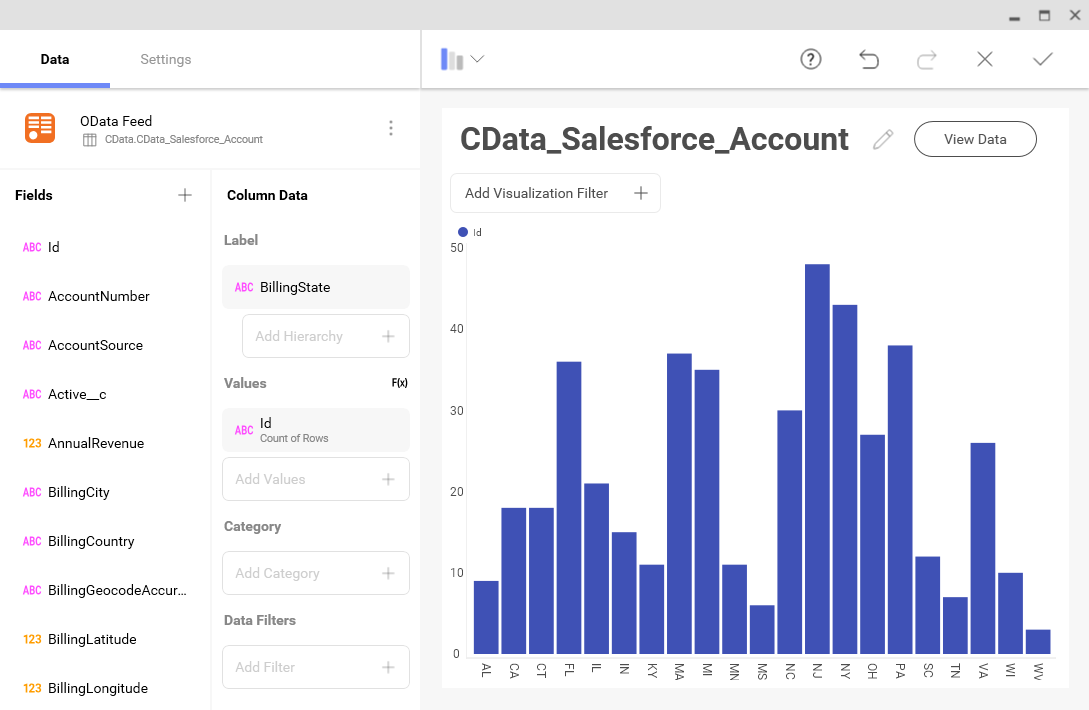
- Select fields and choose a chart type
![Visualizing data in Reveal (SQL Server is shown.)]()
More Information & Free Trial
At this point, you have created a simple dashboard from live Printify data. For more information on creating OData feeds from Printify (and more than 150 other sources), visit the Connect Server page. Download a free, 30-day trial and start working live Printify data in tools that consume OData APIs.

