Model Context Protocol (MCP) finally gives AI models a way to access the business data needed to make them really useful at work. CData MCP Servers have the depth and performance to make sure AI has access to all of the answers.
Try them now for free →Create Salesforce-Connected Dashboards in Grafana
Connect to Salesforce Data via CData Connect Cloud in Grafana and create custom business dashboards with real-time access to Salesforce data.
Grafana is an open-source platform that allows users to analyze, monitor, and visualize telemetry from various data sources. When combined with CData Connect Cloud, you gain immediate access to Salesforce data for business dashboards. This article outlines the process of connecting to Salesforce using Connect Cloud and creating a basic dashboard from Salesforce data within Grafana.
CData Connect Cloud offers a pure SQL Server, cloud-to-cloud interface for Salesforce, enabling the creation of dashboards directly from live Salesforce data within Grafana, all without the need for data replication to a native database. As you build visualizations, Grafana generates SQL queries to gather data. With its inherent optimized data processing capabilities, CData Connect Cloud efficiently channels all supported SQL operations, including filters and JOINs, directly to Salesforce. This leverages server-side processing to swiftly deliver the requested Salesforce data.
About Salesforce Data Integration
Accessing and integrating live data from Salesforce has never been easier with CData. Customers rely on CData connectivity to:
- Access to custom entities and fields means Salesforce users get access to all of Salesforce.
- Create atomic and batch update operations.
- Read, write, update, and delete their Salesforce data.
- Leverage the latest Salesforce features and functionalities with support for SOAP API versions 30.0.
- See improved performance based on SOQL support to push complex queries down to Salesforce servers.
- Use SQL stored procedures to perform actions like creating, retrieving, aborting, and deleting jobs, uploading and downloading attachments and documents, and more.
Users frequently integrate Salesforce data with:
- other ERPs, marketing automation, HCMs, and more.
- preferred data tools like Power BI, Tableau, Looker, and more.
- databases and data warehouses.
For more information on how CData solutions work with Salesforce, check out our Salesforce integration page.
Getting Started
Configure Salesforce Connectivity for Grafana
Connectivity to Salesforce from Grafana is made possible through CData Connect Cloud. To work with Salesforce data from Grafana, we start by creating and configuring a Salesforce connection.
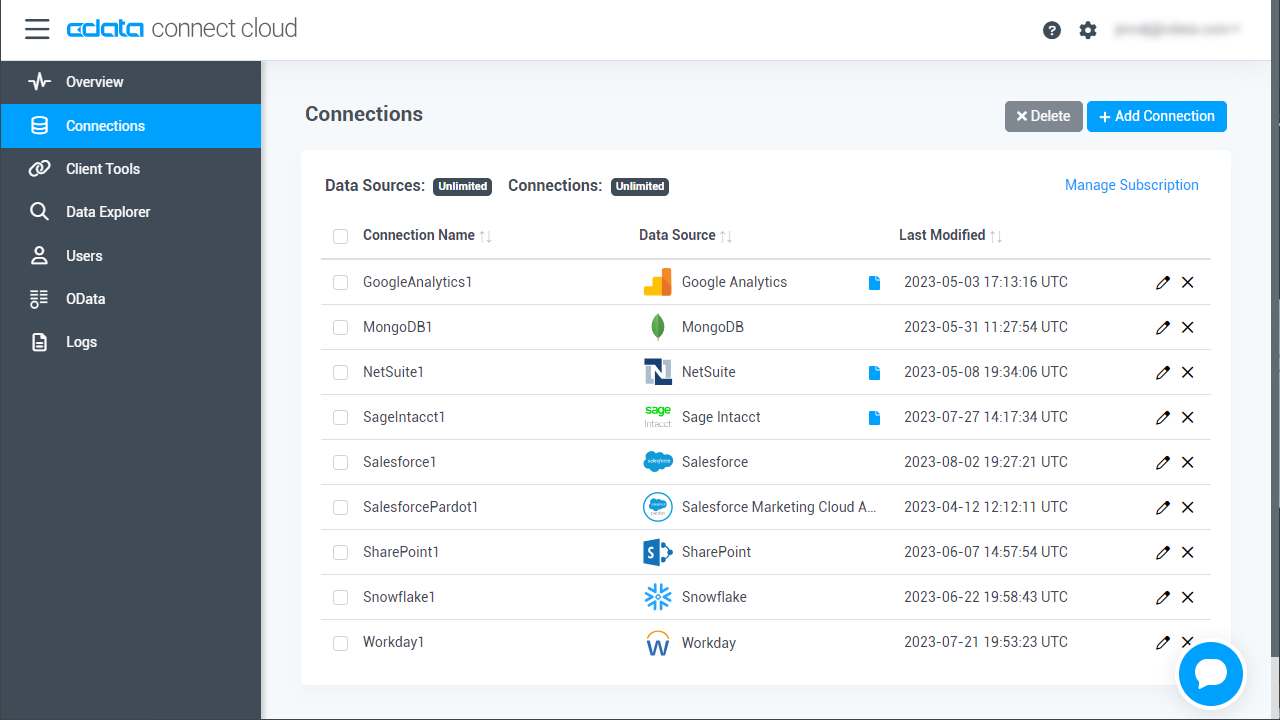
- Log into Connect Cloud, click Connections and click Add Connection
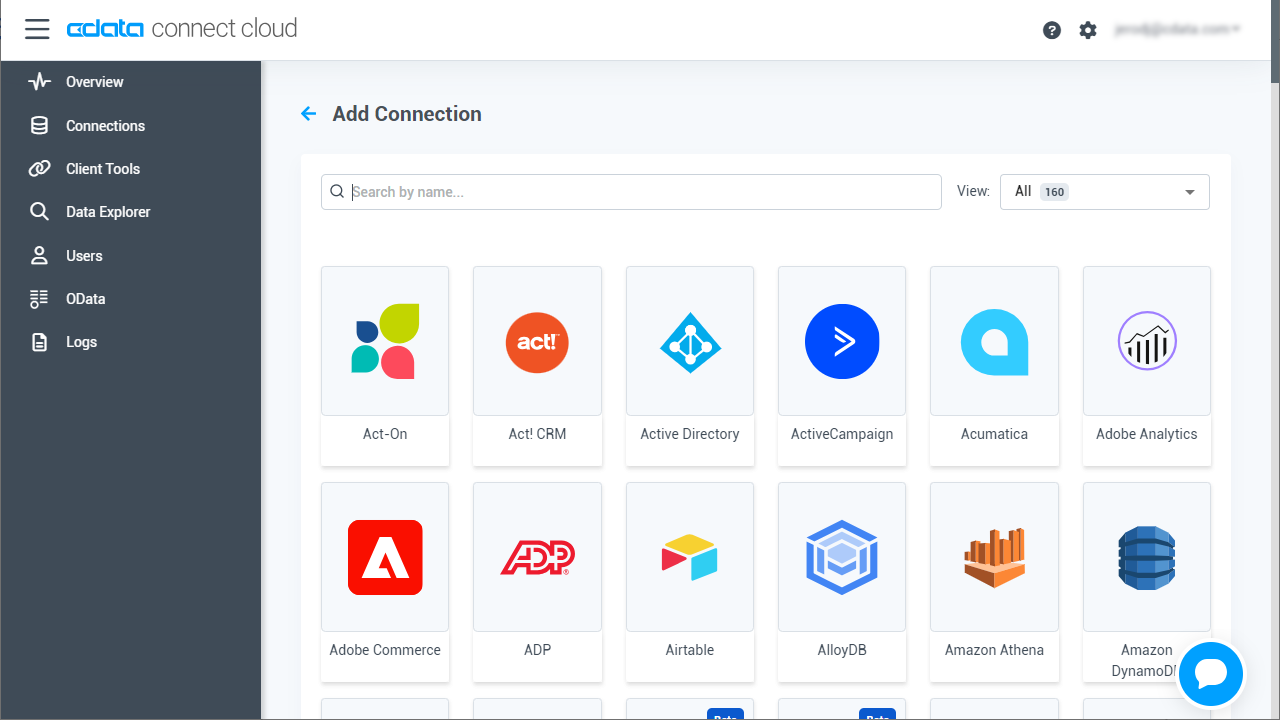
- Select "Salesforce" from the Add Connection panel
-
Enter the necessary authentication properties to connect to Salesforce.
There are several authentication methods available for connecting to Salesforce: Login, OAuth, and SSO. The Login method requires you to have the username, password, and security token of the user.
If you do not have access to the username and password or do not wish to require them, you can use OAuth authentication.
SSO (single sign-on) can be used by setting the SSOProperties, SSOLoginUrl, and TokenUrl connection properties, which allow you to authenticate to an identity provider. See the "Getting Started" chapter in the help documentation for more information.
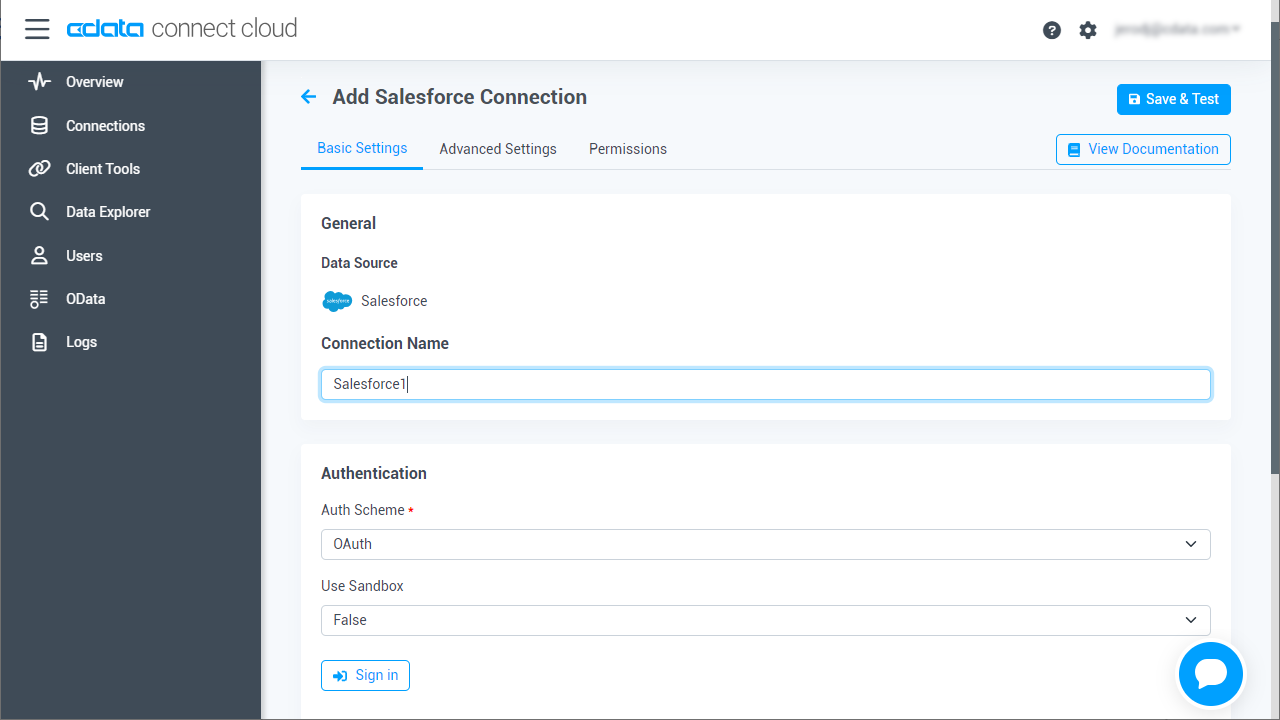
- Click Create & Test
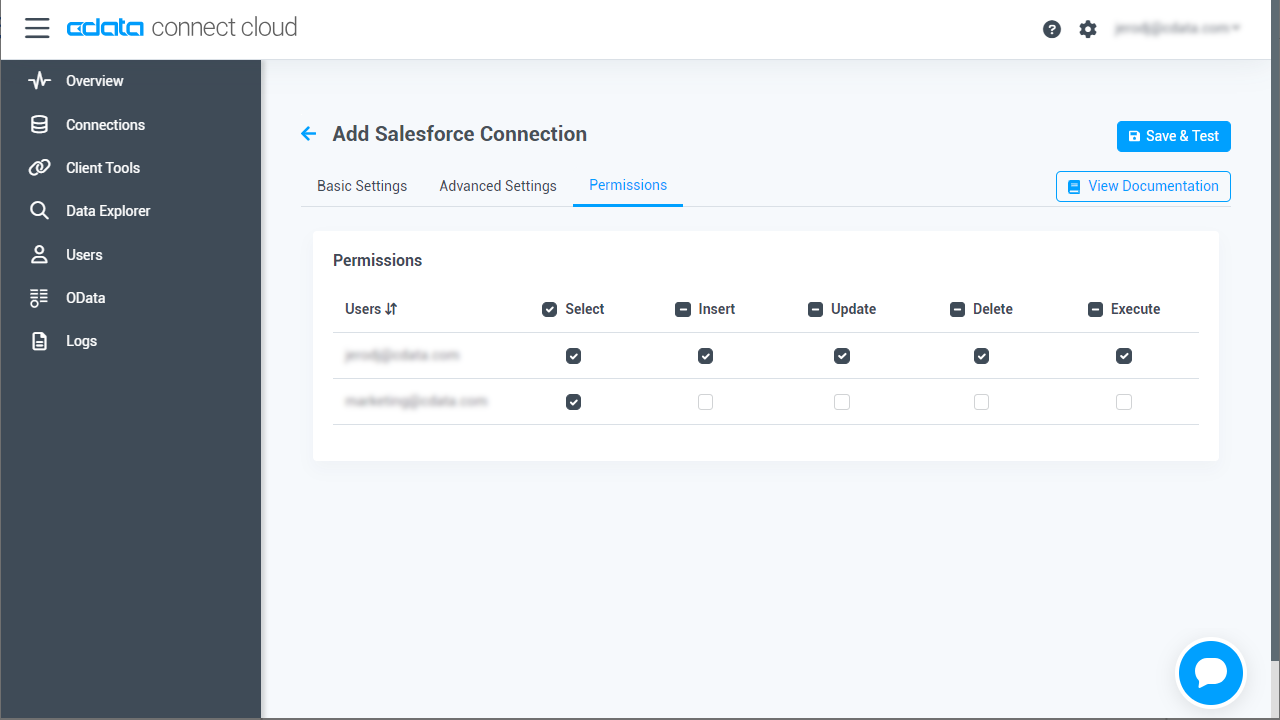
- Navigate to the Permissions tab in the Add Salesforce Connection page and update the User-based permissions.
Add a Personal Access Token
If you are connecting from a service, application, platform, or framework that does not support OAuth authentication, you can create a Personal Access Token (PAT) to use for authentication. Best practices would dictate that you create a separate PAT for each service, to maintain granularity of access.
- Click on your username at the top right of the Connect Cloud app and click User Profile.
- On the User Profile page, scroll down to the Personal Access Tokens section and click Create PAT.
- Give your PAT a name and click Create.
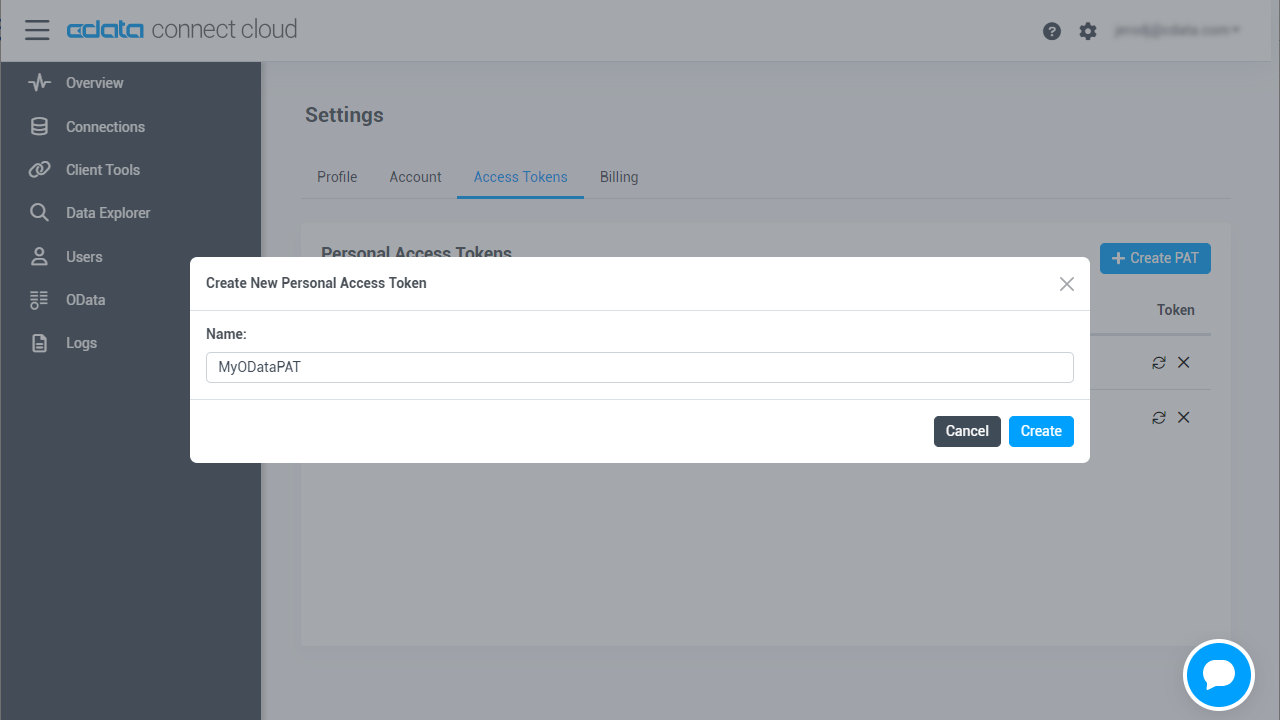
- The personal access token is only visible at creation, so be sure to copy it and store it securely for future use.
With the connection configured, you are ready to connect to Salesforce data from Grafana.
Visualize Live Salesforce Data in Grafana
To establish a connection from Grafana to the CData Connect Cloud Virtual SQL Server API, follow these steps.
- If you have not already done so, download and install Grafana for your operating system from the Grafana Website. Once installed, access Grafana at http://localhost:3000/.
- Log in to Grafana with your username and password for Grafana. If this is your first time logging in, the username is admin and the password is admin.
-
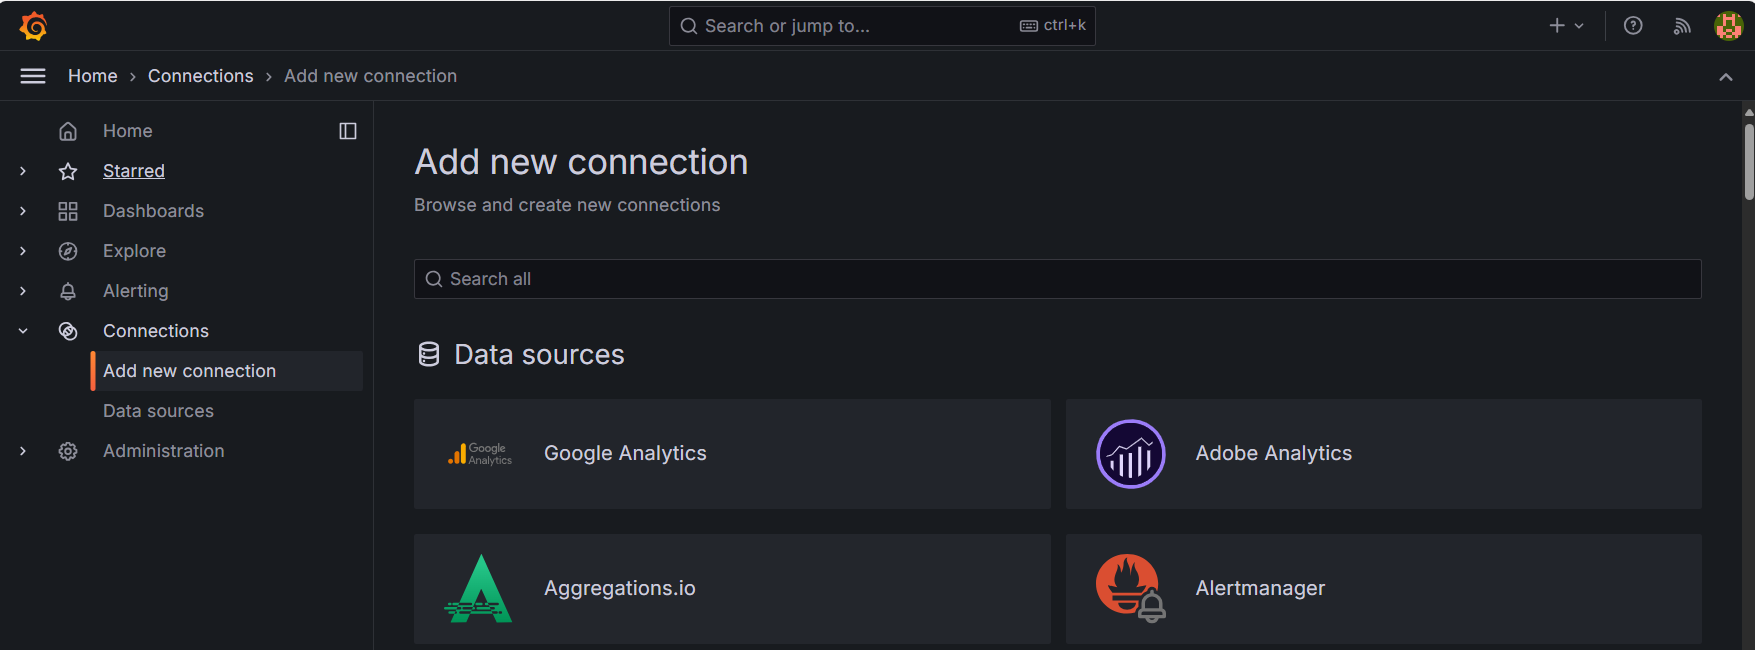
On the navigation menu, click Connections > Add new connection. On this page, you can search for Microsoft SQL Server and select it as your data source.
-
Select Microsoft SQL Server and click Add new data source.

-
Enter a name for the new data source and then enter the following connection settings:
- Host: tds.cdata.com:14333
- Database: enter the Connection Name of the CData Connect Cloud data source you want to connect to (for example, Salesforce1).
- Username: enter your CData Connect Cloud username. This is displayed in the top-right corner of the CData Connect Cloud interface. For example, test@cdata.com.
- Password: enter the PAT you previously generated.
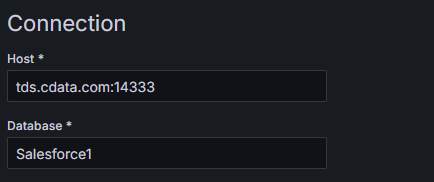
- Click Save & Test. A Database Connect OK message appears when you have a successful connection established.
Create a Dashboard
Once you create the data source for Salesforce, you can start building dashboards on Salesforce data. Start in the navigation menu and click Dashboards
- On the Dashboards page, click + Create dashboard, then click + Add visualization.
-
This opens the Select data source window where you can select your created connection.

-
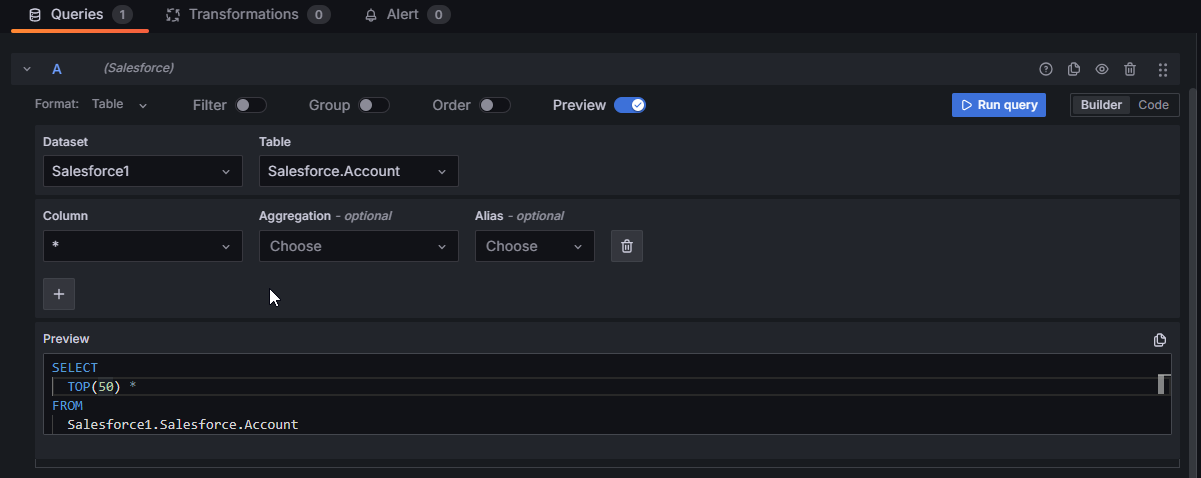
After selecting your connection, you can choose the tables and columns that you want to query for your visualization. Then press Run Query to run the generated query.
-
After running your query, the resulting data is populated above the query editor. Here you can select the visualization that you want to use to present your data on the dashboard panel.
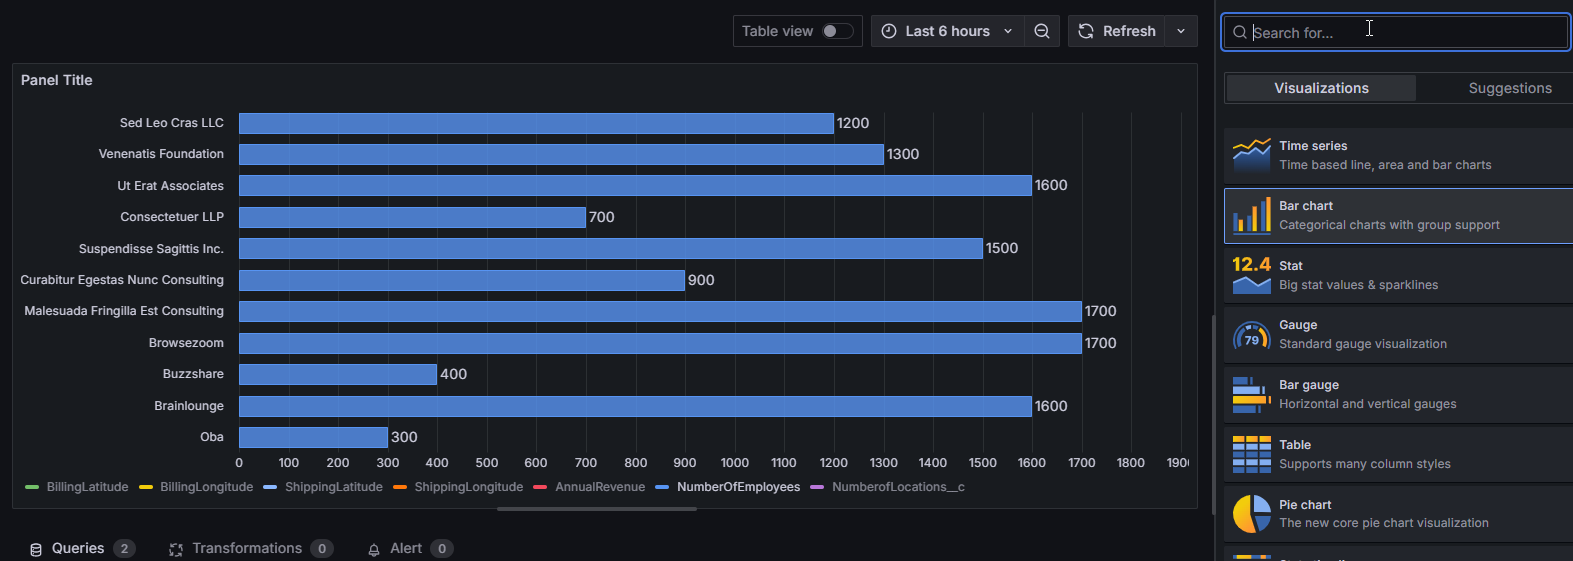
- When you have finished editing your panel, you can click Save dashboard to save the changes made to your Dashboard.
To get live data access to 100+ SaaS, Big Data, and NoSQL sources directly from your cloud applications, try CData Connect Cloud today!

