Model Context Protocol (MCP) finally gives AI models a way to access the business data needed to make them really useful at work. CData MCP Servers have the depth and performance to make sure AI has access to all of the answers.
Try them now for free →Connect to SharePoint Data in Jaspersoft Studio
Execute SQL to remote SharePoint data in Jaspersoft Studio.
This article shows how to connect to SharePoint from Jaspersoft Studio as a standard JDBC data source with the CData JDBC Driver for SharePoint. You will use the standard Jaspersoft wizards to build SQL queries to SharePoint. The queries are executed directly to the SharePoint APIs, enabling real-time connectivity to SharePoint data.
About SharePoint Data Integration
Accessing and integrating live data from SharePoint has never been easier with CData. Customers rely on CData connectivity to:
- Access data from a wide range of SharePoint versions, including Windows SharePoint Services 3.0, Microsoft Office SharePoint Server 2007 and above, and SharePoint Online.
- Access all of SharePoint thanks to support for Hidden and Lookup columns.
- Recursively scan folders to create a relational model of all SharePoint data.
- Use SQL stored procedures to upload and download documents and attachments.
Most customers rely on CData solutions to integrate SharePoint data into their database or data warehouse, while others integrate their SharePoint data with preferred data tools, like Power BI, Tableau, or Excel.
For more information on how customers are solving problems with CData's SharePoint solutions, refer to our blog: Drivers in Focus: Collaboration Tools.
Getting Started
Connect to SharePoint Data as a JDBC Data Source
To create a JDBC data source in Jaspersoft Studio, create a data adapter:
- In the Repository Explorer view, right-click the Data Adapters node and click Create Data Adapter.
- Select Database JDBC Connection.
- Enter a user-friendly name for the driver.
- On the Driver Classpath tab, click Add. In the resulting dialog, navigate to the lib subfolder of the installation directory. Select the driver JAR.
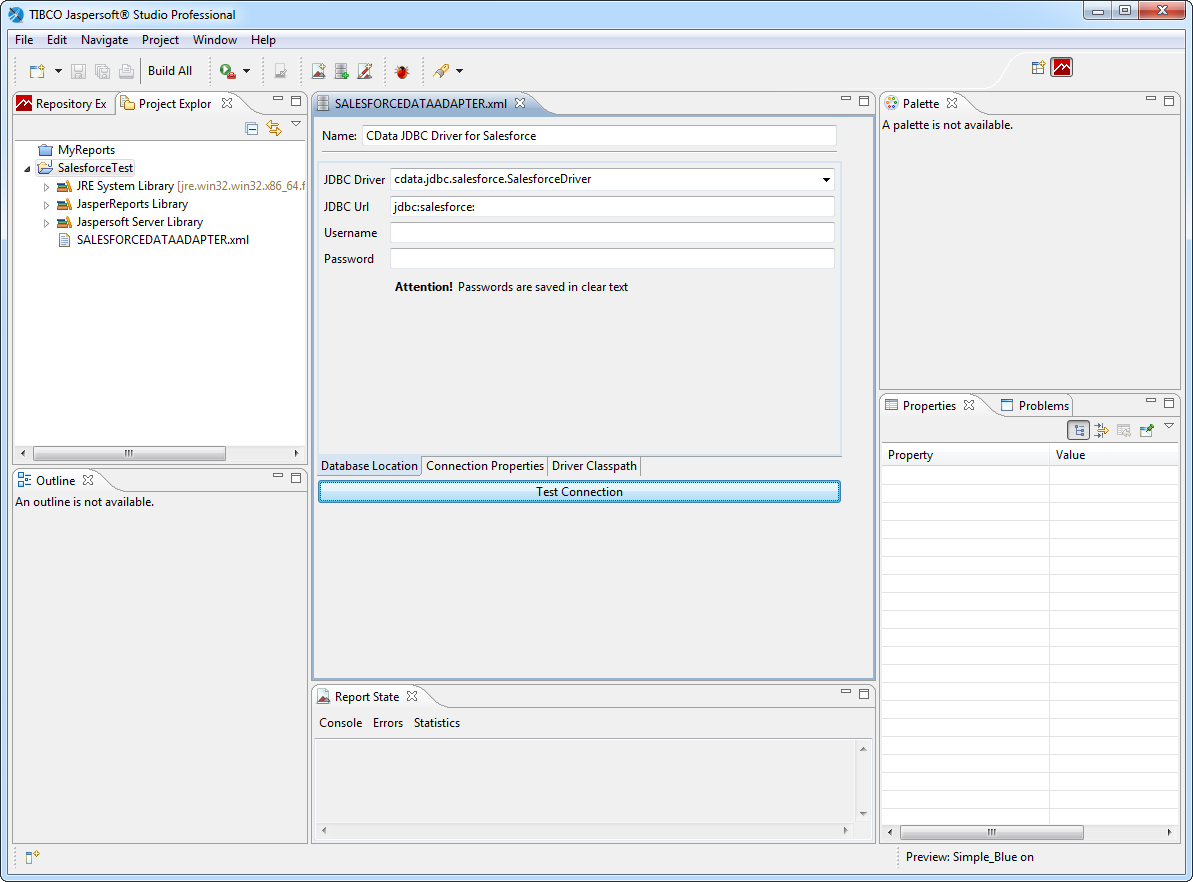
- On the Database Location tab, enter the class name of the JDBC driver: cdata.jdbc.sharepoint.SharePointDriver.
- Enter the JDBC URL.
Set the URL property to the base SharePoint site or to a sub-site. This allows you to query any lists and other SharePoint entities defined for the site or sub-site.
The User and Password properties, under the Authentication section, must be set to valid SharePoint user credentials when using SharePoint On-Premise.
If you are connecting to SharePoint Online, set the SharePointEdition to SHAREPOINTONLINE along with the User and Password connection string properties. For more details on connecting to SharePoint Online, see the "Getting Started" chapter of the help documentation
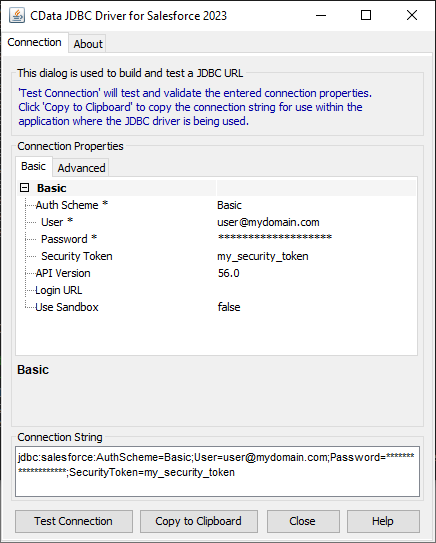
Built-in Connection String Designer
For assistance in constructing the JDBC URL, use the connection string designer built into the SharePoint JDBC Driver. Either double-click the JAR file or execute the jar file from the command-line.
java -jar cdata.jdbc.sharepoint.jarFill in the connection properties and copy the connection string to the clipboard.
![Using the built-in connection string designer to generate a JDBC URL (Salesforce is shown.)]()
When you configure the JDBC URL, you may also want to set the Max Rows connection property. This will limit the number of rows returned, which is especially helpful for improving performance when designing reports and visualizations.
Below is a typical JDBC URL for SharePoint:
jdbc:sharepoint:User=myuseraccount;Password=mypassword;Auth Scheme=NTLM;URL=http://sharepointserver/mysite;SharePointEdition=SharePointOnPremise;![A data adapter configured to use the JDBC Driver. (Salesforce is shown.)]()
Create Reports with SharePoint Data
Follow the steps below to build an SQL query to SharePoint, the basis of a simple report:
- Click File -> New Jasper Report. Select a template, select the parent project, and specify the report file.
- In the Data Adapter menu, select the data adapter you created in the previous section.
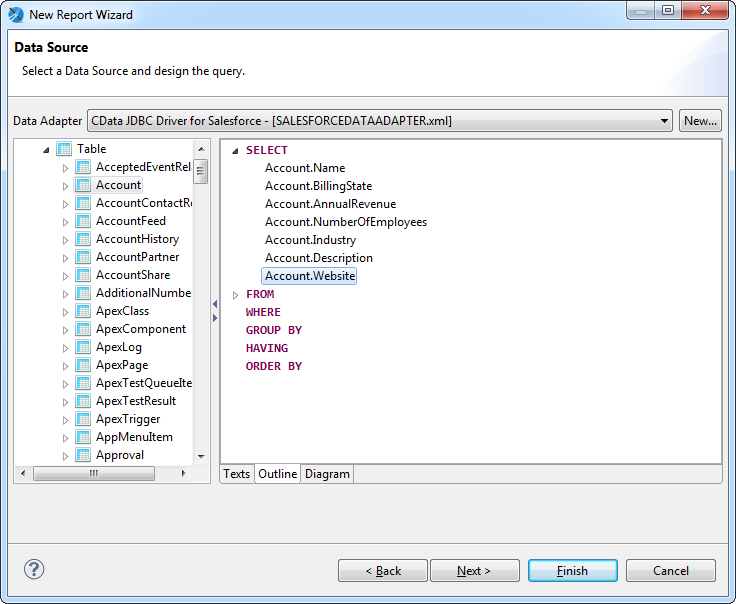
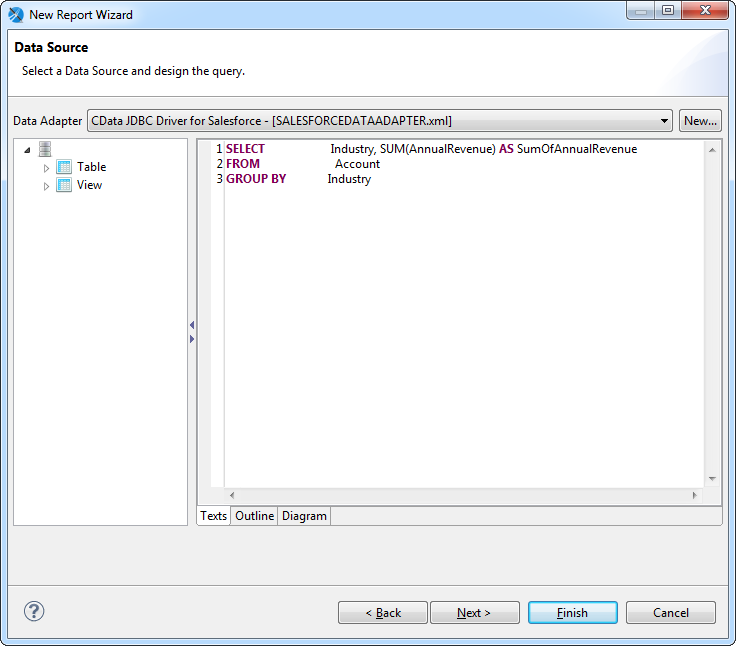
- In the Diagram tab, drag tables into the box and click the columns you want. Or, enter a custom query on the Texts tab. For example:
SELECT Name, Revenue FROM MyCustomList![The SQL query to be used to pull data into the report. (Salesforce is shown.)]()
- Select the fields you want to include in the dataset. This example uses all fields.
- Skip the Group By step and finish the wizard.
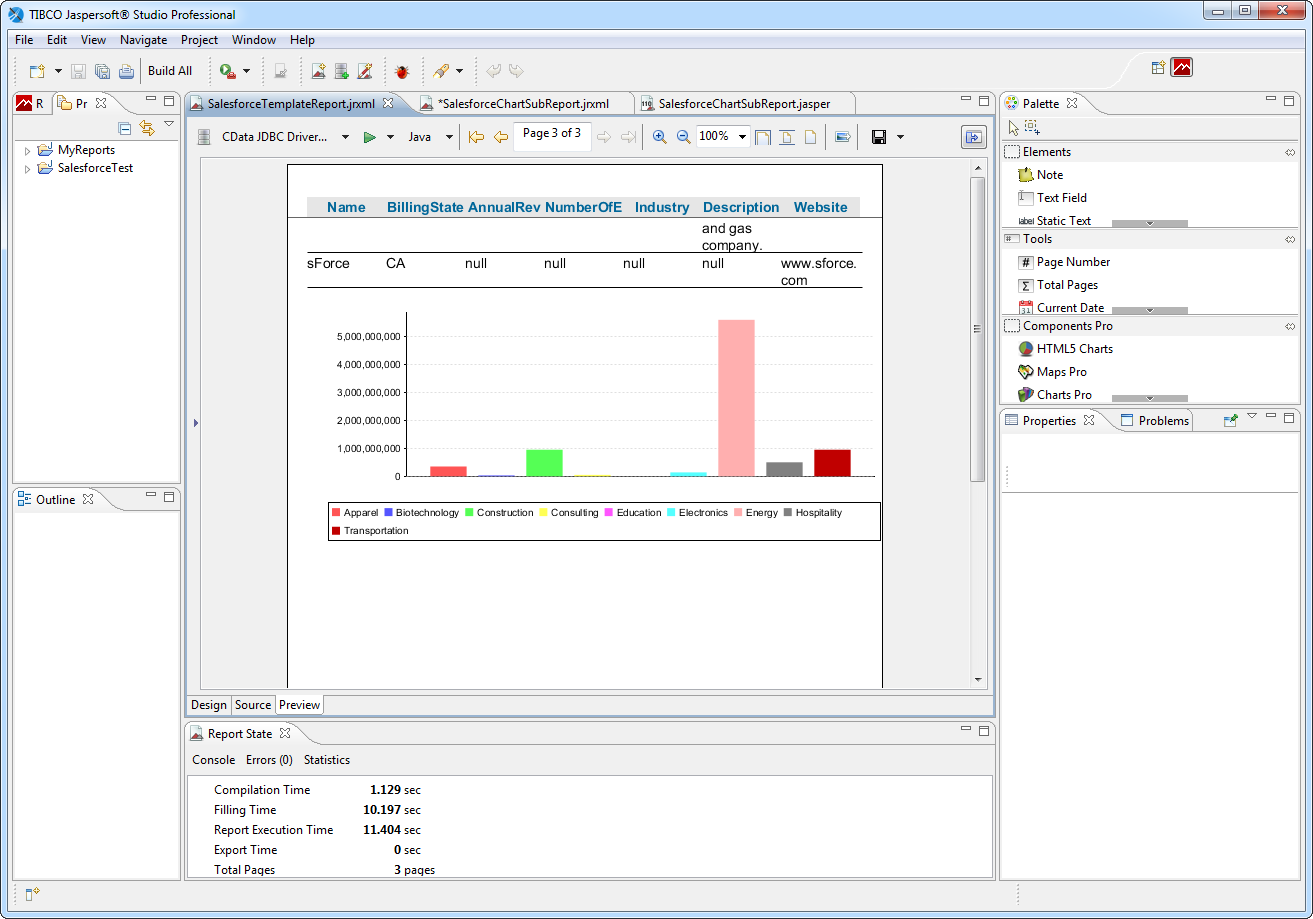
In the Preview tab, you can see the report as it would look with the current SharePoint data.

Create a Chart
The following sections show how to create a chart tied to its own SQL query. When retrieving the data from the remote data source, more restrictive queries, written for specific report objects, can result in faster performance.
Create a DataSet
Follow the steps below to create a new dataset to populate the chart:
- In the report editing area, click the Design tab.
- In the Outline view, right-click the root node for the report and click Create Dataset.
- Enter a name for the dataset and click the option to create a new dataset from a connection or data source.
- In the Data Adapter menu, select the data adapter you created in the first section.
- Enter a query such as the following:
SELECT Name, Revenue FROM MyCustomList![The SQL query to be used to fill the chart. (Salesforce is shown.)]()
- Select the fields you want in the dataset. This example uses Name and Revenue.
- Skip the step to group by fields and finish the wizard.
Configure the Chart
After adding the dataset, follow the steps below to map column values to the chart axes in the chart wizard:
- Click the Summary node in the Outline view. In the Properties view, set the height to 400 pixels. The summary band is printed at the end of the report.
- Drag a chart from the Palette onto the summary. The chart wizard is displayed.
- Select the chart type. This example uses a bar chart.
- In the Dataset menu, select the dataset you created for the chart.
- In the Dataset tab, select the option to use the same JDBC connection used to fill the master report.
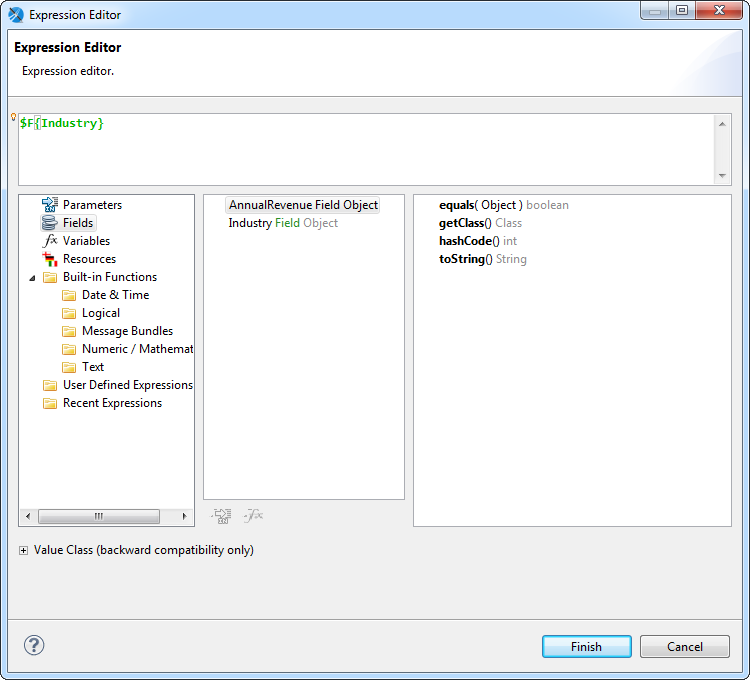
- Specify the chart's series: Click the button next to the Series menu and click Add. In the Expression Editor that is displayed, double-click the Name column to set the expression to $F{Name}.
![The column selected as the Series for the chart.]()
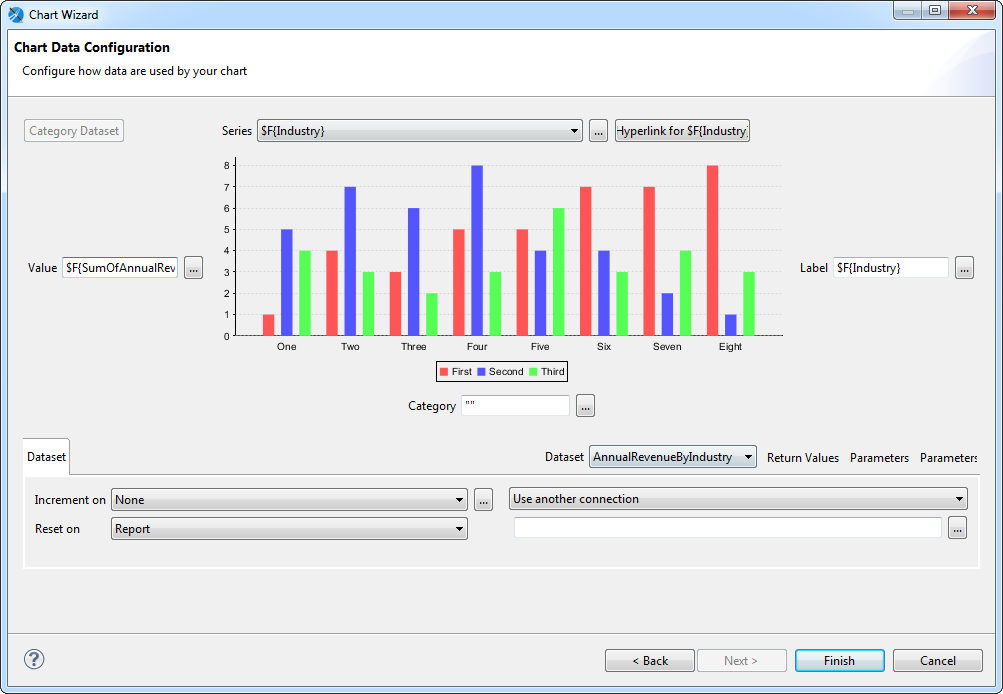
Specify the y-axis values: In the chart wizard, click the button next to the Value box. In the Expression Editor, double-click Revenue to set the expression to $F{Revenue}.
- Specify the labels for the series elements: In the chart wizard, click the button next to the Label box. In the Expression Editor, double-click the Name column to set the expression to $F{Name}. If needed, convert the column type to string, as in the following expression:
$F{Name}.toString()![Columns selected for the axes of the chart.]()
- Expand the chart to fill the summary section: right-click the chart and click Size to Container -> Fit Both.
Running the Report
You can now generate reports on SharePoint data just as you would any other JDBC data source. Jaspersoft Studio periodically refreshes the data across report runs.
