Model Context Protocol (MCP) finally gives AI models a way to access the business data needed to make them really useful at work. CData MCP Servers have the depth and performance to make sure AI has access to all of the answers.
Try them now for free →Visualize SQL Server Data in TIBCO Spotfire through OData
Integrate SQL Server data into dashboards in TIBCO Spotfire.
OData is a major protocol enabling real-time communication among cloud-based, mobile, and other online applications. The CData API Server, when paired with the ADO.NET Provider for SQL Server, provides SQL Server data (or data from 200+ other ADO.NET Providers) to OData consumers like TIBCO Spotfire. This article shows how to use the API Server and Spotfire's built-in support for OData to access SQL Server data in real time.
Set Up the API Server
Follow the steps below to begin producing secure SQL Server OData services:
Deploy
The API Server runs on your own server. On Windows, you can deploy using the stand-alone server or IIS. On a Java servlet container, drop in the API Server WAR file. See the help documentation for more information and how-tos.
The API Server is also easy to deploy on Microsoft Azure, Amazon EC2, and Heroku.
Connect to SQL Server
After you deploy the API Server and the ADO.NET Provider for SQL Server, provide authentication values and other connection properties needed to connect to SQL Server by clicking Settings -> Connections and adding a new connection in the API Server administration console.
Connecting to Microsoft SQL Server
Connect to Microsoft SQL Server using the following properties:
- Server: The name of the server running SQL Server.
- User: The username provided for authentication with SQL Server.
- Password: The password associated with the authenticating user.
- Database: The name of the SQL Server database.
Connecting to Azure SQL Server and Azure Data Warehouse
You can authenticate to Azure SQL Server or Azure Data Warehouse by setting the following connection properties:
- Server: The server running Azure. You can find this by logging into the Azure portal and navigating to "SQL databases" (or "SQL data warehouses") -> "Select your database" -> "Overview" -> "Server name."
- User: The name of the user authenticating to Azure.
- Password: The password associated with the authenticating user.
- Database: The name of the database, as seen in the Azure portal on the SQL databases (or SQL warehouses) page.
When you configure the connection, you may also want to set the Max Rows connection property. This will limit the number of rows returned, which is especially helpful for improving performance when designing reports and visualizations.
You can then choose the SQL Server entities you want to allow the API Server access to by clicking Settings -> Resources.
Authorize API Server Users
After determining the OData services you want to produce, authorize users by clicking Settings -> Users. The API Server uses authtoken-based authentication and supports the major authentication schemes. Access can also be restricted based on IP address; by default only connections to the local machine are allowed. You can authenticate as well as encrypt connections with SSL.
Create Data Visualizations on External SQL Server Data
- Open Spotfire and click Add Data Tables -> OData.
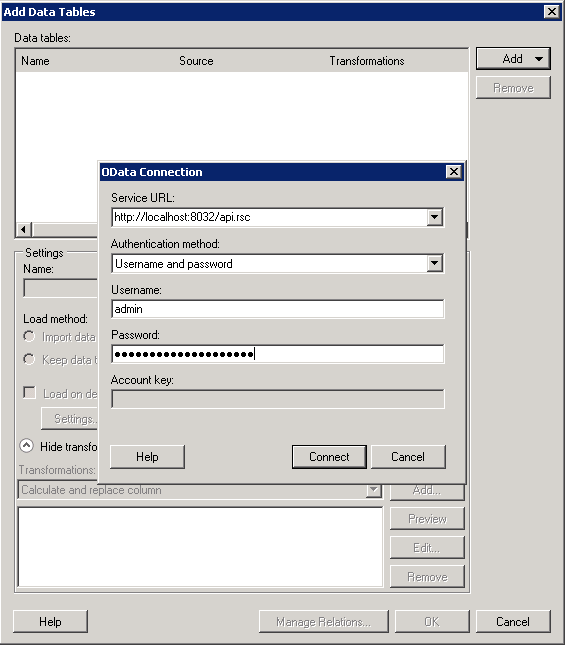
- In the OData Connection dialog, enter the following information:
- Service URL: Enter the API Server's OData endpoint. For example:
http://localhost:8032/api.rsc - Authentication Method: Select Username and Password.
- Username: Enter the username of an API Server user. You can create API users on the Security tab of the administration console.
- Password: Enter the authtoken of an API Server user.

- Service URL: Enter the API Server's OData endpoint. For example:
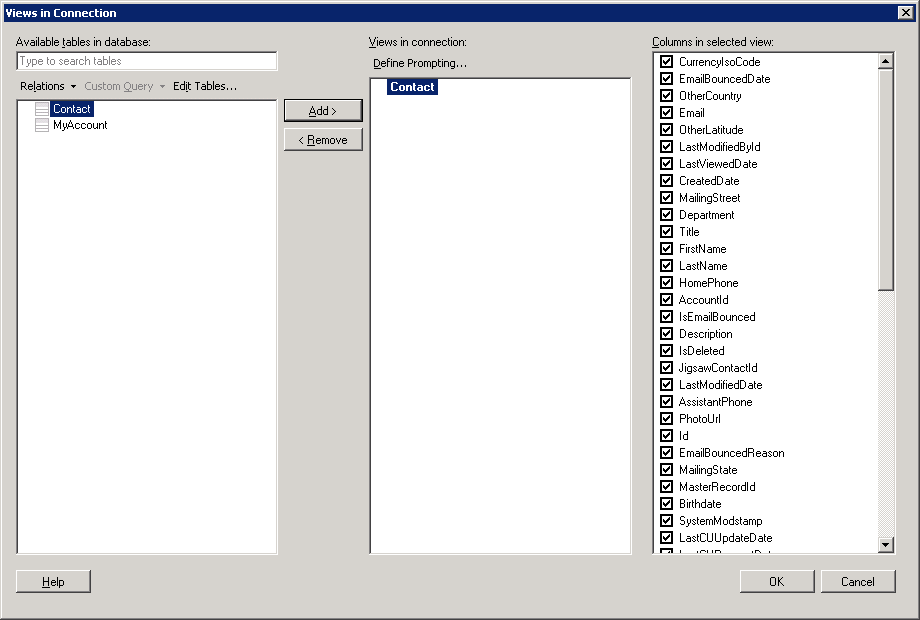
- Select the tables and columns you want to add to the dashboard. This example uses Orders.

- If you want to work with the live data, click the Keep Data Table External option. This option enables your dashboards to reflect changes to the data in real time.
If you want to load the data into memory and process the data locally, click the Import Data Table option. This option is better for offline use or if a slow network connection is making your dashboard less interactive.
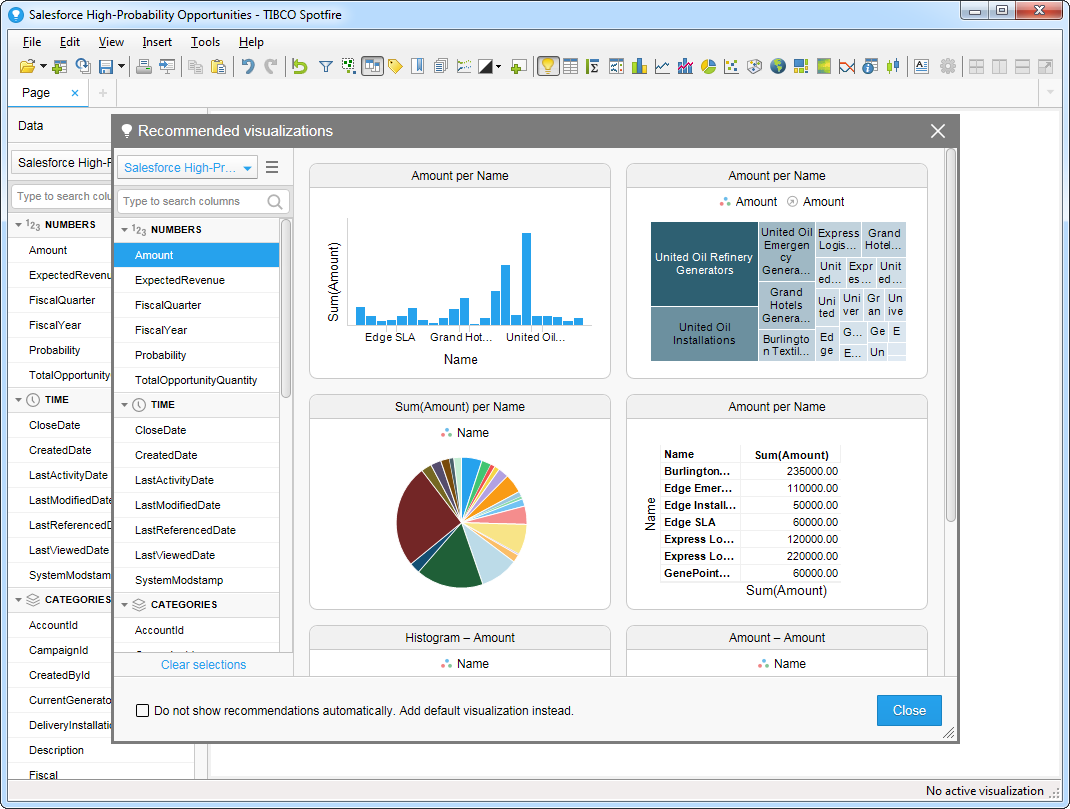
- After adding tables, the Recommended Visualizations wizard is displayed. When you select a table, Spotfire uses the column data types to detect number, time, and category columns. This example uses Freight in the Numbers section and ShipName in the Categories section.

After adding several visualizations in the Recommended Visualizations wizard, you can make other modifications to the dashboard. For example, you can apply a filter: After clicking the Filter button, the available filters for each query are displayed in the Filters pane.
