Model Context Protocol (MCP) finally gives AI models a way to access the business data needed to make them really useful at work. CData MCP Servers have the depth and performance to make sure AI has access to all of the answers.
Try them now for free →Integrate WooCommerce Data in the Pentaho Report Designer
Publish reports based on WooCommerce data in the Pentaho BI tool.
The CData JDBC driver for WooCommerce data enables access to live data from dashboards and reports. This article shows how to connect to WooCommerce data as a JDBC data source and publish reports based on WooCommerce data in Pentaho.
Connect and Create a Report
- Copy the JAR file of the driver, located in the lib subfolder of the installation directory, to the \Report-Designer\lib\jdbc\ folder in the Pentaho directory.
- Run the report-designer.bat file in the \Report-Designer\ folder to open the Report-Designer UI.
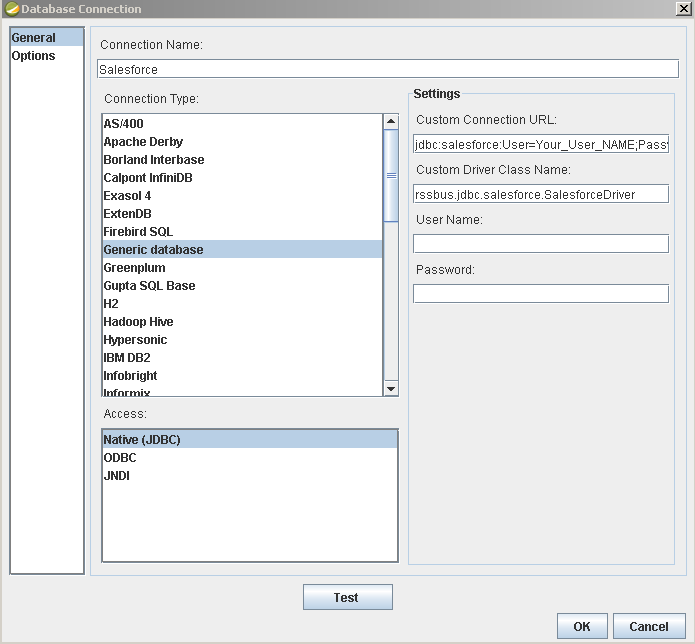
Create a new data source with the driver by clicking Data -> Add Data Source -> Advanced -> JDBC (Custom) and then creating a new WooCommerce connection. In the resulting dialog, configure the connection properties as shown below.
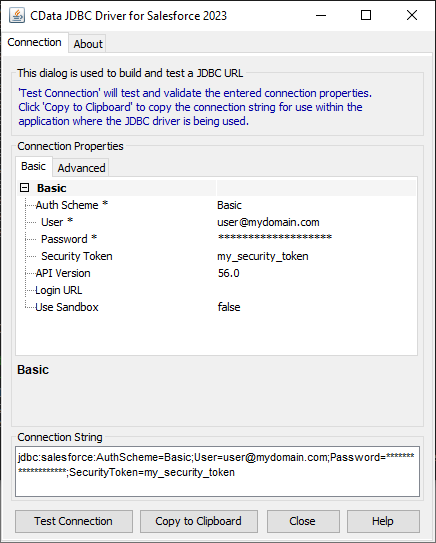
Custom Connection URL property: Enter the JDBC URL. This starts with jdbc:woocommerce: and is followed by a semicolon-separated list of connection properties.
WooCommerce supports the following authentication methods: one-legged OAuth1.0 Authentication and standard OAuth2.0 Authentication.
Connecting using one-legged OAuth 1.0 Authentication
Specify the following properties (NOTE: the below credentials are generated from WooCommerce settings page and should not be confused with the credentials generated by using WordPress OAuth2.0 plugin):
- ConsumerKey
- ConsumerSecret
Connecting using WordPress OAuth 2.0 Authentication
- Custom Driver Class Name: Enter cdata.jdbc.woocommerce.WooCommerceDriver.
- User Name: The username to authenticate with.
- Password: The password to authenticate with.
![Required connection properties defined in the JDBC URL. (Salesforce is shown.)]()
Add WooCommerce Data to a Report
You are now ready to create a report with WooCommerce data.
-
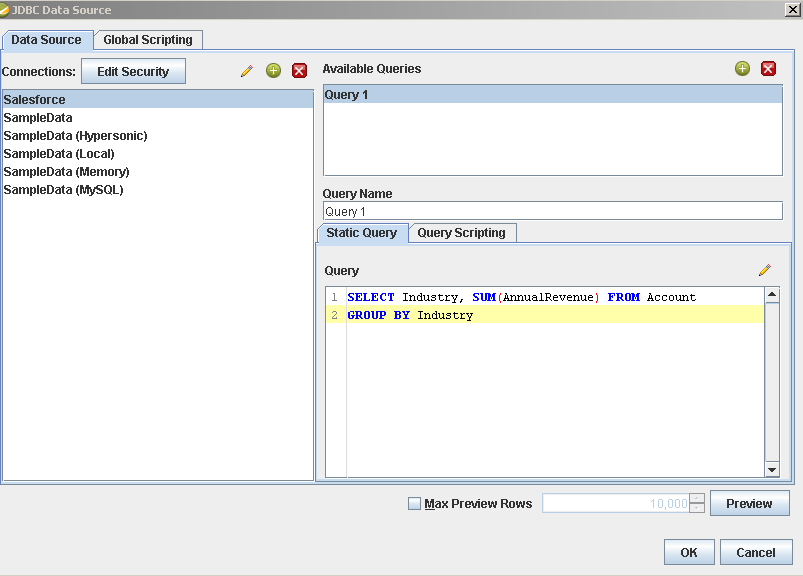
Add the WooCommerce source to your report: Click Data -> Add Data Source -> JDBC and select the data source.
Configure the query. This article uses the one below:
SELECT ParentId, Total FROM Orders WHERE ParentId = '3'![The query to retrieve data, specified in the JDBC data source configuration wizard. (Salesforce is shown.)]()
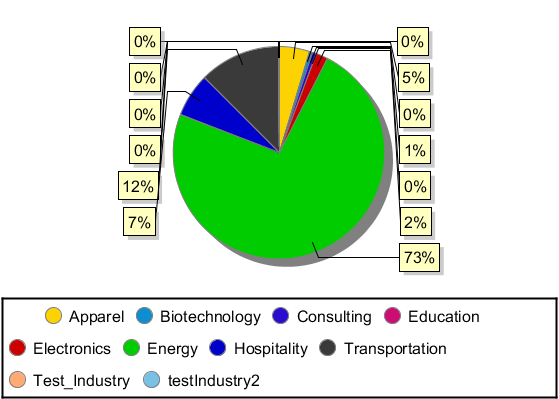
- Drag a chart onto your report and double-click it to edit the chart. Run the report to display the chart. You can use the results of this query to create a simple chart for the Orders table.
- Finally, run the report to see the chart.


