各製品の資料を入手。
詳細はこちら →


SharePoint のデータをDevExpress Data Grid にデータバインドする。
SharePoint 用の CData ADO.NET プロバイダーをDevExpress Windows Forms とWeb コントロールとともに使用し、SharePoint をチャートに入力します。
最終更新日:2022-01-31
この記事で実現できるSharePoint 連携のシナリオ


こんにちは!ウェブ担当の加藤です。マーケ関連のデータ分析や整備もやっています。
SharePoint 用の CData ADO.NET プロバイダーはサードパーティーコントロールで使うことのできる通常のADO.NET データベースアクセスコンポーネントを実装しています。データバインドするための通常のADO.NET プロセスに従うことで、UI コントロールから実データへの双方向アクセスを可能にします。 この記事では、CData を使ってDevExpress Windows Forms とウェブコントロールにデータバインドする方法を説明します。ここでは、最新のデータを表示するチャートにデータバインドします。
SharePoint のベースサイトもしくはサブサイトのURL を設定します。これにより、サイト・サブサイトのすべてのリストを含むSharePoint エンティティをクエリできます。
Authentication セクションのUser、Password を設定します。SharePoint のオンプレミス版の際にはこの値は必須です。
SharePoint Online に接続する場合にはSharePointEdition をSHAREPOINTONLINE に設定し、User とPassword を設定します。詳細はヘルプドキュメントの「はじめに」を参照してください。
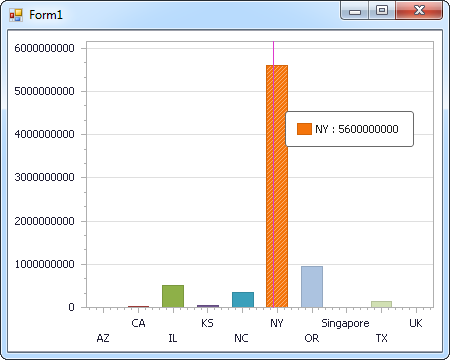
Windows Forms コントロール
下のコードでは、SharePoint でDevExpress のチャートに追加する方法を説明します。SharePointDataAdapter はチャートコントロールのSeries プロパティにバインドします。コントロールのDiagram プロパティはx 軸とy 軸をカラム名として定義します。
using (SharePointConnection connection = new SharePointConnection(
"User=myuseraccount;Password=mypassword;Auth Scheme=NTLM;URL=http://sharepointserver/mysite;SharePointEdition=SharePointOnPremise;")) {
  SharePointDataAdapter dataAdapter = new SharePointDataAdapter(
  "SELECT Name, Revenue FROM MyCustomList", connection);

  DataTable table = new DataTable();
  dataAdapter.Fill(table);
  DevExpress.XtraCharts.Series series = new DevExpress.XtraCharts.Series();
  chartControl1.Series.Add(series);
  DataTable table = new DataTable();
  series.ValueDataMembers.AddRange(new string[] { "Revenue" });
  series.ArgumentScaleType = DevExpress.XtraCharts.ScaleType.Qualitative;
  series.ArgumentDataMember = "Name";
  series.ValueScaleType = DevExpress.XtraCharts.ScaleType.Numerical;
  chartControl1.Legend.Visibility = DevExpress.Utils.DefaultBoolean.False;
  ((DevExpress.XtraCharts.SideBySideBarSeriesView)series.View).ColorEach = true;
}
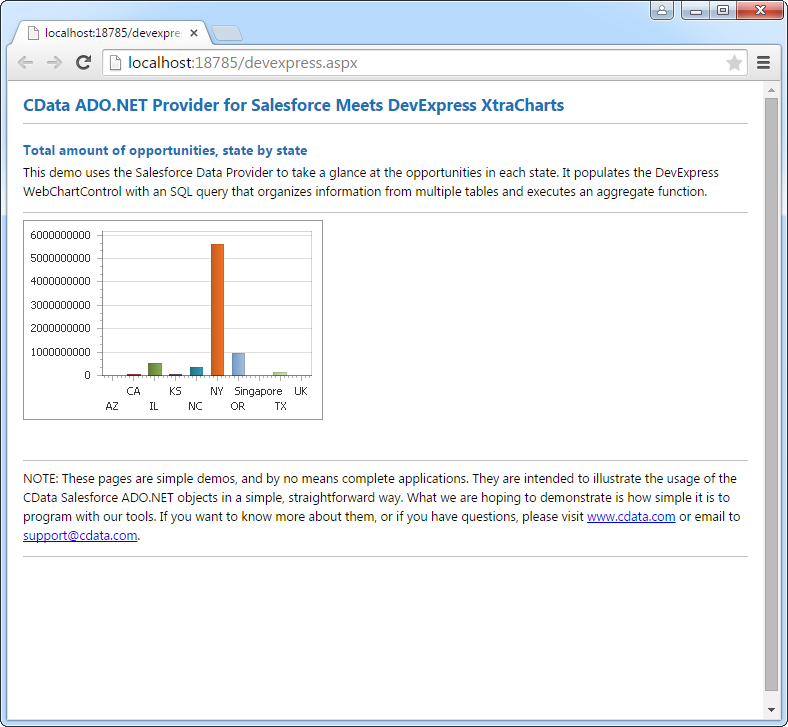
Web コントロール
下のコードではSharePoint でDevExpress Web を操作するための設定方法を説明します。SharePointDataAdapter はチャートのSeries プロパティにバインドします。Diagram プロパティはx 軸とy 軸をカラム名として定義します。
using DevExpress.XtraCharts;

using (SharePointConnection connection = new SharePointConnection(
"User=myuseraccount;Password=mypassword;Auth Scheme=NTLM;URL=http://sharepointserver/mysite;SharePointEdition=SharePointOnPremise;"))
{
  SharePointDataAdapter SharePointDataAdapter1 = new SharePointDataAdapter("SELECT Name, Revenue FROM MyCustomList", connection);
  DataTable table = new DataTable();
  SharePointDataAdapter1.Fill(table);
  DevExpress.XtraCharts.Series series = new Series("Series1", ViewType.Bar);
  WebChartControl1.Series.Add(series);
  DataTable table = new DataTable();
  series.ValueDataMembers.AddRange(new string[] { "Revenue" });
  series.ArgumentScaleType = ScaleType.Qualitative;
  series.ArgumentDataMember = "Name";
  series.ValueScaleType = ScaleType.Numerical;
  ((DevExpress.XtraCharts.SideBySideBarSeriesView)series.View).ColorEach = true;
}