各製品の資料を入手。
詳細はこちら →


SurveyMonkey のデータをDevExpress Data Grid にデータバインドする。
SurveyMonkey 用の CData ADO.NET プロバイダーをDevExpress Windows Forms とWeb コントロールとともに使用し、SurveyMonkey をチャートに入力します。
最終更新日:2022-01-31
この記事で実現できるSurveyMonkey 連携のシナリオ


こんにちは!ウェブ担当の加藤です。マーケ関連のデータ分析や整備もやっています。
SurveyMonkey 用の CData ADO.NET プロバイダーはサードパーティーコントロールで使うことのできる通常のADO.NET データベースアクセスコンポーネントを実装しています。データバインドするための通常のADO.NET プロセスに従うことで、UI コントロールから実データへの双方向アクセスを可能にします。 この記事では、CData を使ってDevExpress Windows Forms とウェブコントロールにデータバインドする方法を説明します。ここでは、最新のデータを表示するチャートにデータバインドします。
SurveyMonkey はOAuth 2 認証標準を利用しています。SurveyMonkey がアンケートの回答を読むためにこれを必要とすることを考えると、アンケートを読むアカウントには有料プランのサブスクリプションが必要です。
SurveyMonkey への接続に使用できる認証方法は2つあります。
- プライベートoauth アプリケーションを登録するときに、パーソナルアクセストークンを使用します。
- パブリックoauth アプリケーションを登録するときに、OAuth を使用します。
パーソナルアクセストークンの使用
個人用トークンを使用して、自分のデータをテストし、アクセスします。個人用トークンを取得するには、ヘルプの「Creating a Custom OAuth App」の手順に従って、次の接続プロパティを設定します。
- OAuthAccessToken:アプリケーション設定で生成されたAccessToken に設定。
- InitiateOAuth:OFF に設定。
OAuth の使用
CData 製品はすでにSurveyMonkey にOAuth アプリケーションとして登録されています。そのため、デフォルトでは、自動的に埋め込みクレデンシャルを使用して接続します。
独自のカスタムOAuth アプリを使用したい場合は、ヘルプのCustom Credentials を参照してください。
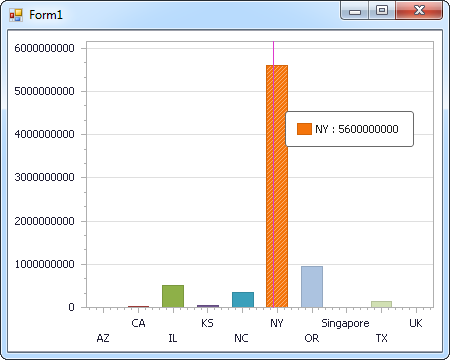
Windows Forms コントロール
下のコードでは、SurveyMonkey でDevExpress のチャートに追加する方法を説明します。SurveyMonkeyDataAdapter はチャートコントロールのSeries プロパティにバインドします。コントロールのDiagram プロパティはx 軸とy 軸をカラム名として定義します。
using (SurveyMonkeyConnection connection = new SurveyMonkeyConnection(
"OAuthClientId=MyOAuthClientId;OAuthClientSecret=MyOAuthClientSecret;CallbackURL=http://localhost:portNumber;")) {
  SurveyMonkeyDataAdapter dataAdapter = new SurveyMonkeyDataAdapter(
  "SELECT RespondentId, ChoiceId FROM MySurvey_Responses", connection);

  DataTable table = new DataTable();
  dataAdapter.Fill(table);
  DevExpress.XtraCharts.Series series = new DevExpress.XtraCharts.Series();
  chartControl1.Series.Add(series);
  DataTable table = new DataTable();
  series.ValueDataMembers.AddRange(new string[] { "ChoiceId" });
  series.ArgumentScaleType = DevExpress.XtraCharts.ScaleType.Qualitative;
  series.ArgumentDataMember = "RespondentId";
  series.ValueScaleType = DevExpress.XtraCharts.ScaleType.Numerical;
  chartControl1.Legend.Visibility = DevExpress.Utils.DefaultBoolean.False;
  ((DevExpress.XtraCharts.SideBySideBarSeriesView)series.View).ColorEach = true;
}
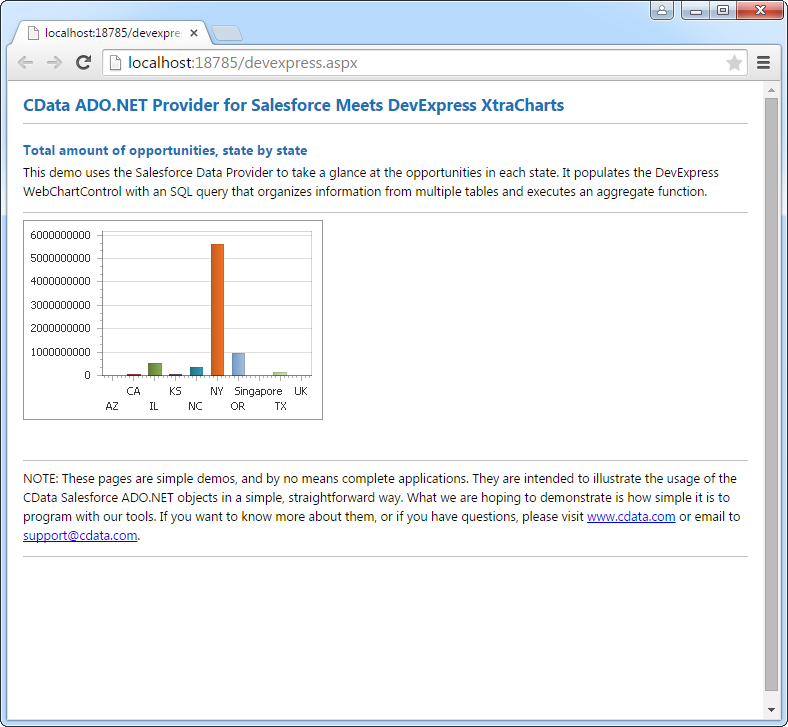
Web コントロール
下のコードではSurveyMonkey でDevExpress Web を操作するための設定方法を説明します。SurveyMonkeyDataAdapter はチャートのSeries プロパティにバインドします。Diagram プロパティはx 軸とy 軸をカラム名として定義します。
using DevExpress.XtraCharts;

using (SurveyMonkeyConnection connection = new SurveyMonkeyConnection(
"OAuthClientId=MyOAuthClientId;OAuthClientSecret=MyOAuthClientSecret;CallbackURL=http://localhost:portNumber;"))
{
  SurveyMonkeyDataAdapter SurveyMonkeyDataAdapter1 = new SurveyMonkeyDataAdapter("SELECT RespondentId, ChoiceId FROM MySurvey_Responses", connection);
  DataTable table = new DataTable();
  SurveyMonkeyDataAdapter1.Fill(table);
  DevExpress.XtraCharts.Series series = new Series("Series1", ViewType.Bar);
  WebChartControl1.Series.Add(series);
  DataTable table = new DataTable();
  series.ValueDataMembers.AddRange(new string[] { "ChoiceId" });
  series.ArgumentScaleType = ScaleType.Qualitative;
  series.ArgumentDataMember = "RespondentId";
  series.ValueScaleType = ScaleType.Numerical;
  ((DevExpress.XtraCharts.SideBySideBarSeriesView)series.View).ColorEach = true;
}